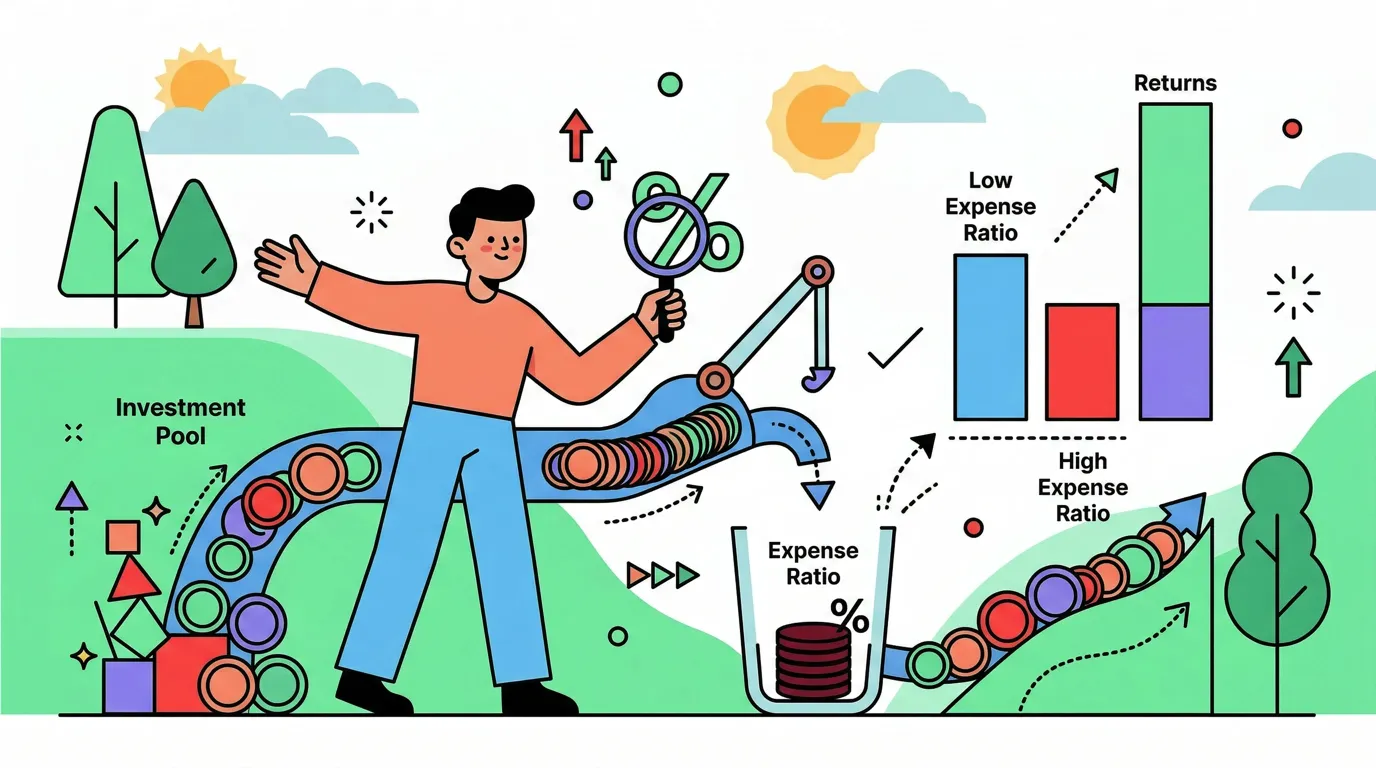
Every mutual fund and ETF charges a fee for managing your money. This fee is called an expense ratio, and while it looks small on paper, it can quietly eat tens of thousands of dollars from your investment returns over a lifetime. Most investors never notice because the fee is deducted automatically, never showing up as a line item on a statement.
Understanding expense ratios is one of the most practical steps you can take toward smarter investing. This guide breaks down what they are, how they work, what counts as a good ratio, and why tracking all of your financial costs, including investment fees, gives you a clearer picture of where your money actually goes. For a broader view of managing your finances, see our complete guide to personal finance.
What Is an Expense Ratio
An expense ratio is the annual fee that a mutual fund or exchange-traded fund (ETF) charges its shareholders to cover operating costs. It is expressed as a percentage of the fund's average net assets. A fund with a 0.50% expense ratio charges $5 per year for every $1,000 you have invested.
The fee covers several costs:
- Management fees: Compensation for the fund manager or management team
- Administrative costs: Record-keeping, customer service, and legal compliance
- Distribution fees (12b-1 fees): Marketing and distribution expenses
- Other operating expenses: Auditing, custodial services, and reporting
You never write a check for this fee. Instead, the fund deducts it from the total assets daily in small increments, which reduces the fund's net asset value. This is why many investors remain unaware of how much they are actually paying.
How Expense Ratios Are Calculated
The formula is straightforward:
Expense Ratio = Total Fund Operating Costs / Average Total Assets Under Management
If a fund manages $500 million in assets and incurs $2.5 million in annual operating costs, its expense ratio is 0.50%.
You can find a fund's expense ratio in its prospectus, on the fund company's website, or on financial data sites like Morningstar. It is updated annually and must be disclosed by law.
What the expense ratio does not include:
- Trading costs: Brokerage commissions the fund pays when buying and selling securities
- Sales loads: One-time fees charged when you buy or sell fund shares
- Account fees: Charges from your brokerage for maintaining an account
These additional costs matter too, but they are reported separately. The expense ratio reflects only the ongoing annual operating fee.
What Is a Good Expense Ratio
Expense ratios vary widely depending on the type of fund, its investment strategy, and whether it is actively or passively managed.
| Fund Type | Typical Expense Ratio | Considered Low | Considered High |
|---|---|---|---|
| Index funds (passive) | 0.03% to 0.20% | Below 0.10% | Above 0.30% |
| Actively managed equity funds | 0.50% to 1.00% | Below 0.50% | Above 1.00% |
| Bond funds | 0.10% to 0.75% | Below 0.30% | Above 0.75% |
| Target-date funds | 0.10% to 0.70% | Below 0.20% | Above 0.70% |
| Specialty/sector funds | 0.50% to 1.50% | Below 0.60% | Above 1.00% |
As a general benchmark, anything below 0.20% is considered low-cost. Broad market index funds from providers like Vanguard, Fidelity, and Schwab now offer expense ratios as low as 0.015%, and some index funds charge 0.00% as a competitive strategy.
Actively managed funds charge more because they employ analysts, researchers, and portfolio managers who attempt to outperform the market. Whether that higher cost is worth it depends on the fund's track record after fees, not before.
How Expense Ratios Eat Into Your Returns
The real impact of expense ratios becomes visible over long time horizons. A difference of 0.50% may seem trivial in a single year, but compounding amplifies it dramatically.
Consider two investors, each starting with $50,000 and contributing $500 monthly for 30 years. Both earn 7% annual market returns before fees.
| Scenario | Expense Ratio | Final Balance | Lost to Fees |
|---|---|---|---|
| Low-cost index fund | 0.05% | $661,400 | $4,200 |
| Moderate active fund | 0.50% | $627,300 | $38,300 |
| High-cost active fund | 1.00% | $591,500 | $74,100 |
The investor paying 1.00% instead of 0.05% loses nearly $70,000 to fees alone. That money does not disappear into better performance. It simply goes to the fund company. And because the fee is deducted before returns are reported, many investors never realize the gap exists.
This compounding effect works against you because every dollar taken in fees is a dollar that no longer earns returns. Over decades, those lost returns on lost dollars add up substantially.
Active vs Passive: The Expense Ratio Question
The debate between active and passive investing often comes down to fees.
Passive funds (index funds and index ETFs) track a market benchmark like the S&P 500. They require minimal management, which keeps costs low. Most charge between 0.03% and 0.20%.
Active funds employ managers who pick securities, time the market, and attempt to beat benchmarks. This expertise costs money, resulting in higher expense ratios typically between 0.50% and 1.50%.
The data consistently shows that most actively managed funds underperform their benchmark index after fees over long periods. According to the SPIVA scorecard, roughly 85% to 90% of large-cap active funds trail the S&P 500 over 15-year periods. The higher expense ratio is a headwind that active managers must overcome just to match index performance.
This does not mean active management is always wrong. Some fund categories, such as small-cap or international funds, may offer more opportunity for skilled managers. But the expense ratio should always factor into the decision. An active fund charging 1.20% needs to consistently beat its benchmark by at least 1.20% just to match a low-cost index alternative.
Hidden Investment Costs Beyond the Expense Ratio
The expense ratio is the most visible investment fee, but it is not the only one. A complete view of your investment costs should include:
Transaction costs: Every time a fund buys or sells securities, it incurs brokerage commissions and bid-ask spreads. Funds with high turnover ratios trade more frequently, generating higher transaction costs that reduce returns but do not appear in the expense ratio.
Tax drag: Funds that trade frequently generate capital gains distributions, which are taxable events for shareholders. Index funds tend to be more tax-efficient because they trade less.
Advisory fees: If you use a financial advisor, their fee (often 0.50% to 1.00% of assets) stacks on top of the fund's expense ratio. A 1.00% advisory fee plus a 0.75% fund fee means you are paying 1.75% annually before your money earns anything.
Account fees: Some brokerages charge maintenance fees, inactivity fees, or transfer fees that add to your total cost.
When you add these up, the total cost of investing can be significantly higher than the expense ratio alone suggests.
Why Tracking All Expenses Matters
Most people think of expense tracking as recording groceries, rent, and utility bills. But investment fees are expenses too. They reduce your wealth just as surely as an overpriced subscription or an unnoticed recurring charge.
The challenge is that investment fees are invisible in daily life. They do not appear on your bank statement or credit card bill. They quietly reduce your portfolio's growth rate without triggering any notification. This is why building a habit of reviewing all financial costs, not just daily spending, matters.
A practical approach is to review your investment fees at least once a year alongside your regular expense review. Check the expense ratio of every fund you own. Calculate the dollar amount you are paying annually. Ask whether a lower-cost alternative exists that offers similar exposure.
For day-to-day expenses, tools like Finny make tracking straightforward. You can log purchases using AI-assisted text or voice input, scan receipts, and review spending patterns over time. The app works offline and stores data locally, so your financial information stays private. While Finny focuses on daily expense tracking rather than investment portfolio analysis, the habit of tracking spending carries over to all financial decisions, including evaluating investment fees.
For tips on building consistent tracking habits, see our guide on how to track expenses.
How to Lower Your Investment Expense Ratios
If you discover that your funds charge more than necessary, here are practical steps to reduce costs:
1. Switch to Index Funds Where Possible
For broad market exposure (U.S. large-cap, total stock market, international developed markets), low-cost index funds and ETFs are hard to beat. Total stock market index funds are available with expense ratios below 0.05%.
2. Compare Similar Funds
Two funds tracking the same index can have different expense ratios. An S&P 500 index fund from one provider might charge 0.03% while another charges 0.15%. The holdings are nearly identical, but the cost difference compounds over time.
3. Check Your 401(k) Options
Employer-sponsored plans sometimes include high-cost funds because of the plan provider's fee structure. Review your plan's fund lineup and choose the lowest-cost options available. If all options are expensive, consider contributing only enough to capture the employer match and investing additional savings in a low-cost IRA.
4. Avoid Funds with Sales Loads
Front-end loads (charged when you buy) and back-end loads (charged when you sell) add to your total cost on top of the expense ratio. No-load funds are widely available and eliminate this extra layer of fees.
5. Review Annually
Fund companies occasionally lower expense ratios as assets grow. Conversely, some funds raise fees. An annual review ensures you are not overpaying for something that was competitive when you first bought it.

Building the habit of reviewing costs regularly applies to both investments and daily spending. When you routinely check where your money goes, whether it is a $4 coffee or a 0.50% fund fee, you make better decisions across the board. An offline-first expense tracker like Finny helps with the daily side of this habit, letting you log expenses anywhere without needing an internet connection or linking your bank account. For more on tracking without bank connections, see our guide on tracking expenses without linking your bank.
The Bottom Line
An expense ratio is the annual percentage fee that investment funds charge for managing your money. It looks small, often less than 1%, but compounding turns that small percentage into a significant cost over decades. A 1.00% expense ratio on a long-term portfolio can cost you tens of thousands of dollars compared to a 0.05% alternative.
The best approach is straightforward: understand what you are paying, compare it to lower-cost alternatives, and make changes where the math supports it. Index funds offer broad market exposure at minimal cost, and switching from a high-fee fund to a low-fee equivalent is one of the few guaranteed ways to improve your investment returns.
Beyond investments, tracking all of your expenses, from daily purchases to annual fees, gives you complete visibility into your financial life. The same discipline that helps you spot an overpriced fund also helps you identify unnecessary subscriptions, spending patterns, and opportunities to save.
Common Questions About Expense Ratios
What is an expense ratio in simple terms?
An expense ratio is the annual fee a mutual fund or ETF charges to cover its operating costs. It is expressed as a percentage of your investment. A 0.50% expense ratio means you pay $5 per year for every $1,000 invested. The fee is deducted automatically from the fund's assets.
What is a good expense ratio for an index fund?
A good expense ratio for a broad market index fund is below 0.10%. Many total stock market and S&P 500 index funds now charge between 0.015% and 0.05%. Anything above 0.20% for a basic index fund is worth questioning, as lower-cost alternatives likely exist.
Do expense ratios really matter that much?
Yes. Over long investment horizons, even small differences compound significantly. A 0.50% difference in expense ratios on a $50,000 portfolio with regular contributions can cost $30,000 to $40,000 over 30 years. The impact grows with larger portfolios and longer time periods.
How do I find a fund's expense ratio?
Check the fund's prospectus, the fund company's website, or financial data providers like Morningstar. Your brokerage account may also display expense ratios alongside fund details. By law, funds must disclose their expense ratio annually.
Should I always choose the fund with the lowest expense ratio?
Not always, but cost should be a major factor. For funds tracking the same index, the lowest-cost option is usually the best choice. For actively managed funds, consider whether the manager's track record (after fees) justifies the higher cost. In most cases, low-cost index funds are the most reliable long-term choice.
Ready to take control of your everyday spending?
Download Finny to track daily expenses with AI-assisted input, receipt scanning, and offline support. No bank connections required, and your data stays on your device. Building strong expense tracking habits starts with visibility into where every dollar goes.