
Most people know roughly what they earn each month. Far fewer know what they spend each day. That gap between monthly awareness and daily reality is where overspending hides. A $7 lunch here, a $15 impulse buy there: small amounts that feel harmless until the month ends and the numbers do not add up.
Average daily spending is one of the simplest financial metrics you can track. It takes your total expenses and divides them by the number of days, giving you a single number that captures your spending behavior at a glance. This guide covers how to calculate it, what the benchmarks look like at different income levels, and how to use daily spending awareness to stay on track with your budget.
For a broader look at budgeting fundamentals, see our budgeting for beginners guide.
What Is Average Daily Spending
Average daily spending is the total amount you spend over a period divided by the number of days in that period. It gives you a concrete, digestible number that answers the question: how much does my lifestyle actually cost per day?
There are two ways to think about it:
- Backward-looking: Take last month's total expenses and divide by the number of days. This tells you what you actually spent.
- Forward-looking: Take your monthly budget (or income minus savings targets) and divide by the number of days. This tells you what you can afford to spend.
Both numbers are useful. The backward-looking number reveals habits. The forward-looking number sets boundaries.
How to Calculate Your Daily Budget
The basic formula is straightforward.
For actual spending: Total monthly expenses / days in month = average daily spending
For budget planning: (Monthly income - savings - fixed bills) / days in month = daily discretionary budget
The second formula is more actionable. It tells you how much flexible spending you have each day after your non-negotiable expenses and savings are accounted for. For a step-by-step walkthrough of that second formula, see our guide on how to calculate your daily spending allowance.
Step-by-Step Calculation
- Start with monthly take-home pay. Use after-tax income, the amount that actually lands in your account.
- Subtract fixed monthly expenses. Rent, utilities, insurance, loan payments, subscriptions. These do not change day to day.
- Subtract your savings target. Whatever you plan to set aside for savings, investments, or debt payoff.
- Divide the remainder by 30. This gives your daily discretionary budget.
Example:
- Monthly income: $4,000
- Fixed expenses: $2,200 (rent, utilities, insurance, subscriptions)
- Savings target: $400
- Remaining: $1,400
- Daily discretionary budget: $1,400 / 30 = $46.67 per day
That $46.67 covers groceries, dining out, transportation, entertainment, and any other variable spending. When you spend less than that on a given day, you build a buffer. When you spend more, you draw from it.
Average Daily Spending at Different Income Levels
The table below shows example daily budgets using the 50/30/20 rule as a baseline. Under this framework, 50% of income goes to needs, 30% to wants, and 20% to savings. The daily discretionary column shows what remains for flexible, day-to-day spending after fixed needs and savings are removed.
| Monthly Income | Fixed Needs (50%) | Savings (20%) | Flexible Spending (30%) | Daily Discretionary |
|---|---|---|---|---|
| $2,500 | $1,250 | $500 | $750 | $25/day |
| $3,500 | $1,750 | $700 | $1,050 | $35/day |
| $4,500 | $2,250 | $900 | $1,350 | $45/day |
| $5,500 | $2,750 | $1,100 | $1,650 | $55/day |
| $7,000 | $3,500 | $1,400 | $2,100 | $70/day |
These are rough guidelines. Your actual fixed expenses may be higher or lower than 50%, which shifts your daily number. The point is having a target to reference, not a rigid rule.
For more on how the 50/30/20 framework applies to budgeting, see our personal finance complete guide.
The 50/30/20 Rule Connection
The 50/30/20 rule and daily spending awareness work well together. The rule gives you monthly category targets. Daily spending gives you an in-the-moment checkpoint.
Here is how they connect: if you earn $4,000 per month and follow the 50/30/20 split, your "wants" budget is $1,200. That translates to $40 per day for discretionary spending. On a Tuesday when you spend $15, you are ahead. On a Saturday when you spend $80, you know you need lighter days to balance out.
This does not mean you must spend the exact same amount every day. Daily spending naturally fluctuates. Weekends tend to cost more than weekdays. The value of the daily number is awareness, not rigidity.
Why Daily Spending Matters More Than Monthly Totals
Monthly totals arrive too late. By the time you see that you overspent in March, March is already over. Daily awareness provides course correction while there is still time to adjust.
Consider two scenarios:
Scenario A: You check your spending once at month-end. You discover you spent $600 on dining out instead of your $300 target. The money is gone.
Scenario B: You glance at your daily spending midway through the month. You notice your average has crept to $55/day against a $45 target. You adjust for the remaining two weeks and finish the month on budget.
The information is the same. The timing makes all the difference.
Lifestyle Creep Detection
Daily spending averages also reveal lifestyle creep, the gradual increase in spending that follows income growth. If your daily average was $38 six months ago and it is $52 now without a corresponding income increase, something shifted. Maybe dining out became more frequent, or subscription costs accumulated. The daily number makes these slow drifts visible.
For more on identifying and adjusting spending patterns, check our guide on optimizing spending categories.
How Finny Makes Daily Spending Tracking Automatic
Calculating your average daily spending manually means pulling up statements, adding numbers, and dividing. It works, but friction kills consistency. Most people do it once, learn something useful, and then never do it again.
Finny handles this automatically. When you log expenses through text input, AI-assisted chat, or receipt scanning, Finny calculates your running average and displays it as a reference line on your analytics charts.
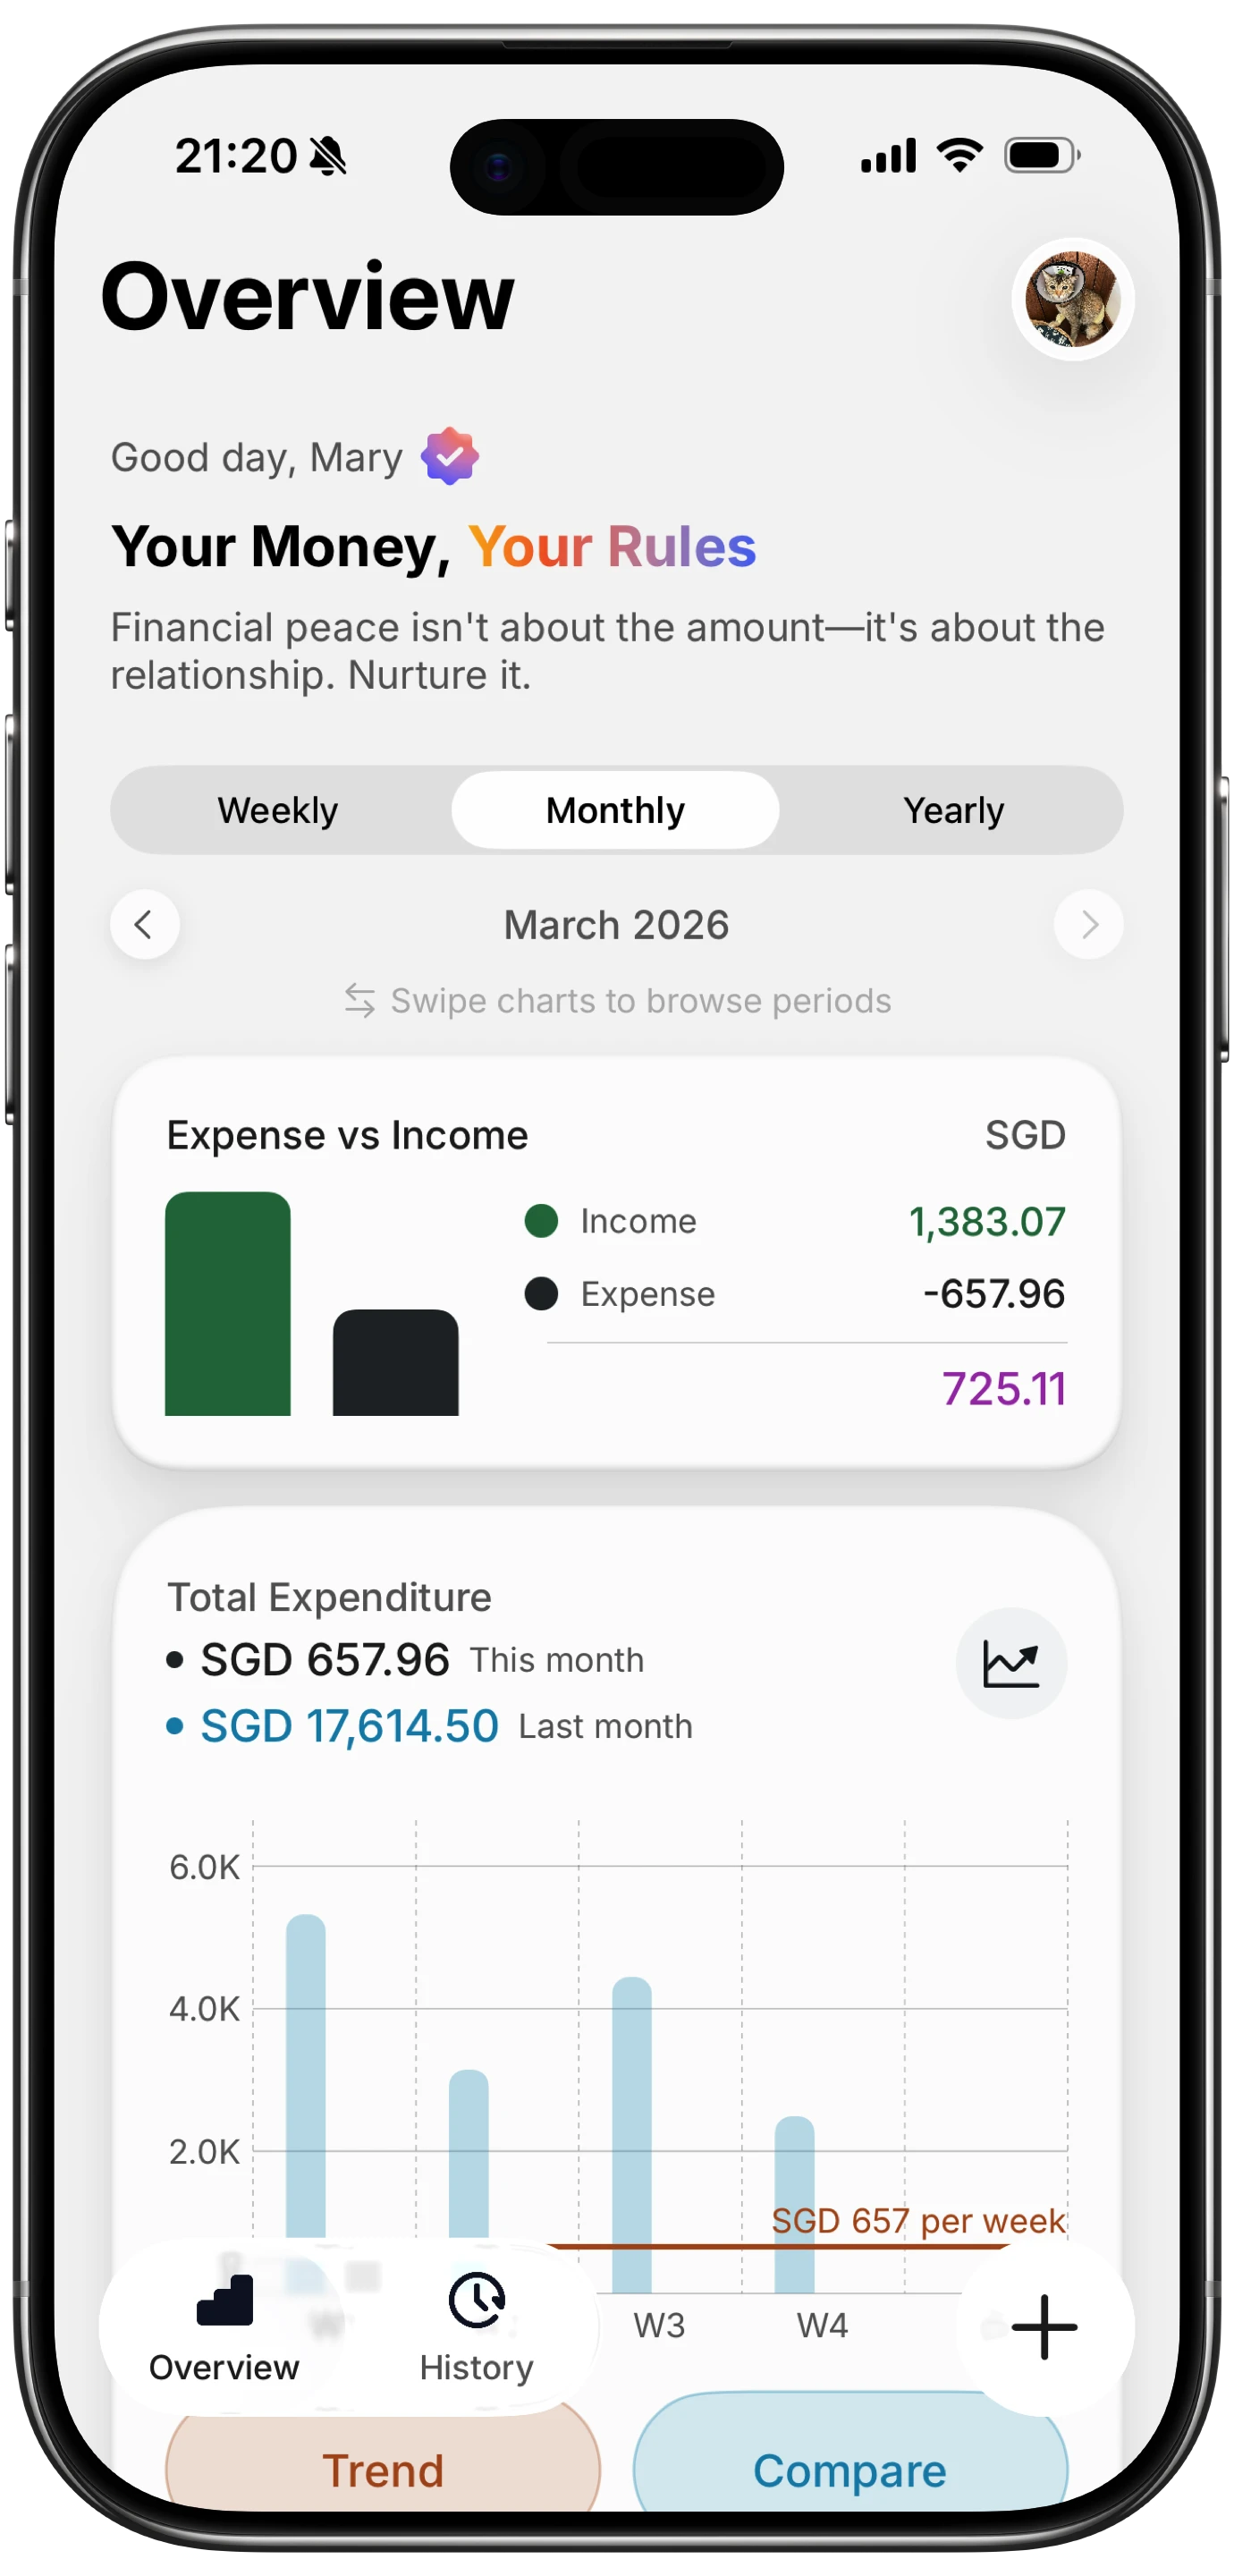
This reference line sits on top of your daily spending bars, showing at a glance whether today's spending is above or below your average. No manual calculation needed.
The overview dashboard also provides a spending summary that rolls up your daily, weekly, and monthly totals so you can see the full picture without switching between screens.
Because Finny works offline, you can log expenses immediately, whether you are on the subway, in a store, or traveling without reliable internet. The data syncs when you reconnect. For more on why offline tracking matters, see our guide on offline expense tracking.
Practical Tips for Staying Within Your Daily Budget
Track in Real Time
The closer you log expenses to the moment of purchase, the more accurate and useful your data becomes. Waiting until the end of the week means relying on memory, which consistently underestimates spending.
Use a Rolling Average, Not a Single Day
One expensive day does not mean failure. What matters is the trend over 7, 14, or 30 days. A $120 car repair on Tuesday is fine if the rest of the week averages $30.
Separate Fixed and Variable Spending
Your daily budget should only include spending you control day to day. Rent and insurance are not daily decisions. Calculate your daily number from variable spending only, and the target becomes more meaningful and actionable.
Build in Buffer Days
Plan for a few low-spending or no-spending days each month. These create room for the inevitable higher-spending days like birthdays, social events, or unexpected needs. For more on this strategy, see our post on building money habits.
Review Weekly
A quick weekly review of your daily spending average catches problems early. Five minutes on Sunday looking at the past seven days is enough to know if you need to adjust for the week ahead.
How Average Daily Spending Compares to Other Metrics
Daily spending is not the only useful metric, but it fills a gap that others leave.
| Metric | What It Tells You | Update Frequency |
|---|---|---|
| Monthly total | Overall spending level | Once per month |
| Category breakdown | Where money goes | Weekly or monthly |
| Average daily spending | Spending intensity per day | Daily |
| Savings rate | How much you keep | Monthly |
Daily spending is the most responsive metric. It changes every day and gives you the fastest feedback loop on your behavior.
For deeper analysis of spending trends and patterns, see our financial analytics guide.
The Bottom Line
Knowing your average daily spending transforms budgeting from a monthly chore into a daily awareness. The calculation is simple: divide your flexible spending budget by 30 to get a target, then track actual spending against it.
You do not need to hit the number perfectly every day. You need to know the number and notice when you are consistently above it. That awareness alone changes spending behavior.
Start with one month of tracking. Calculate your actual daily average. Compare it to what you can afford. The gap between those two numbers tells you exactly what needs to change.
Common Questions About Average Daily Spending
How much should I spend per day?
It depends on your income, fixed expenses, and savings goals. A common starting point: take your monthly income, subtract fixed bills and savings, then divide by 30. For someone earning $4,000 with $2,200 in fixed costs and $400 in savings, the daily budget would be about $47.
Is a daily budget calculator accurate?
A daily budget calculator gives you a useful benchmark, not an exact limit. Daily spending varies naturally. The value is in the average over time, not hitting a precise number each day.
How do I track daily spending without it being tedious?
Use an app that automates categorization and running averages. Logging each expense takes a few seconds. The key is capturing purchases at the point of sale rather than reconstructing spending from memory later.
Does average daily spending include rent and bills?
Typically, no. Fixed monthly bills are better tracked as monthly expenses. Your daily spending number is most useful when it reflects only variable, discretionary spending that you can adjust day to day.
What if my daily spending varies a lot between weekdays and weekends?
That is normal. Most people spend more on weekends. Look at your 7-day rolling average rather than individual days. As long as the weekly pattern averages to your target, the variation is fine.
Ready to see your average daily spending without the math?
Download Finny to log expenses and see your daily spending average calculated automatically. Track with AI, receipts, or text input, with full offline support and no bank connections required.