How Much Do Americans Spend on Christmas? (2026)
Every year two large surveys publish American holiday spending figures, and every year they disagree by a few hundred dollars. Both are correct. They are measuring different things, and knowing which is which is the difference between a useful benchmark and an intimidating one.
This piece covers how much Americans spend on Christmas according to the current data, why the headline numbers diverge, and the one finding that is more useful than any average: estimates fall sharply between October and November, which tells you something important about how holiday budgets actually behave.
The Headline Numbers
| Source | What it measures | Figure per person |
|---|---|---|
| NRF | Total holiday spending | $890.49 |
| NRF, gift portion | Gifts for family and friends | $627.93 |
| NRF, everything else | Food, decorations, cards | $262.56 |
| Gallup | Gifts only, October estimate | $1,007 |
| Gallup, November reading | Gifts only, later estimate | $778 |
The National Retail Federation's figure covers the whole season: gifts, plus the food, decorations, and greeting cards that most people never budget for separately. That second bucket is $262.56 per person, and it is the part that surprises households who planned only for gifts.
Gallup asks a narrower question, about gift spending alone, which is why its number can exceed a total that includes gifts plus everything else. Comparing the two directly is the most common mistake made with this data.
Why the Two Surveys Disagree
Three reasons, and they are worth understanding before you use either number as a benchmark.
Different scope. NRF measures all seasonal spending. Gallup measures gifts. A household spending $890 in total might well be spending $628 of it on gifts, which sits between the two headline figures rather than contradicting either.
Different timing. NRF surveys early in the season. Gallup asks in October and again in November, and the answers move.
Averages include outliers. A small number of very high spenders pull an average upward. The median household spends noticeably less than the mean, which is why the published figure so often feels higher than anything you recognize.
The Most Useful Finding Is the October Drop
Gallup's October estimate of $1,007 fell to $778 by November, a decline of $229 and the largest October-to-November drop the poll has recorded.
That is not people becoming stingier. It is what happens when an intention meets a bank balance. In October, holiday spending is hypothetical and generous. By November the other bills have arrived, the actual cash position is visible, and the number gets revised down.
There are two ways to experience this. One is to plan for $1,000, discover in late November that $778 is the real figure, and spend the last four weeks cutting under time pressure. The other is to work out the realistic number in September, when there is still time to fund it.
The second approach costs nothing and removes almost all of the stress. Our holiday budget planner walks through setting that number from your own cash flow rather than from a national average.
What the Average Hides
A per-person average is a poor guide to what any specific household should spend, for reasons that matter.
Household size drives everything. Two adults with three children are not spending one average. Gift lists scale with the number of people you are close to, not with anything about you.
Income changes the shape, not just the size. Higher-income households spend more in absolute terms but often less as a share of monthly income. The stress of holiday spending tracks the percentage, not the dollar figure.
Regional cost differences are real but smaller for gifts than for travel, which is where geography actually shows up in a holiday budget.
Traditions vary enormously. Households that draw names, cap amounts, or skip adult gifts entirely spend a fraction of the average and do not feel deprived.
If your number is well under $890, that is not a shortfall. It usually means a shorter list or a family agreement that other households would benefit from copying.
Setting Your Own Number Instead
The national averages are context, not a target. A better number comes from three questions:
- How many paychecks remain before the holidays, and what share of each can go to seasonal spending without borrowing?
- How many people are actually on the list, including the ones you forget every year: teachers, hosts, mail carriers, the friend who always gives you something?
- What did last January feel like? If the statement caused a problem, last year's total is a ceiling, not a starting point.
Multiply the first, sanity check against the second, and constrain by the third. That produces a number specific to you, which is worth more than any survey average.
For the gift portion specifically, our guide on budgeting for Christmas gifts covers per-person limits and the additions that break them.
Where the Money Actually Goes
The NRF split is a good planning template, because the non-gift $262.56 is the part that gets missed.
| Category | Share of total |
|---|---|
| Gifts | about 70% |
| Food and hosting | about 12% |
| Decorations | about 8% |
| Cards, wrapping, shipping | about 5% |
| Other seasonal | about 5% |
Most people plan only the first row. The remaining 30% then appears as unbudgeted spending spread across dozens of small purchases, which is precisely the kind of spending that is hardest to notice. Our explainer on discretionary spending covers why these purchases evade attention.
Knowing Your Own Total Requires Tracking It
The reason most households cannot say what they spent last Christmas is that holiday spending fragments across dozens of small transactions in eight weeks. Reconstructing it in January from a card statement is possible but nobody does it.
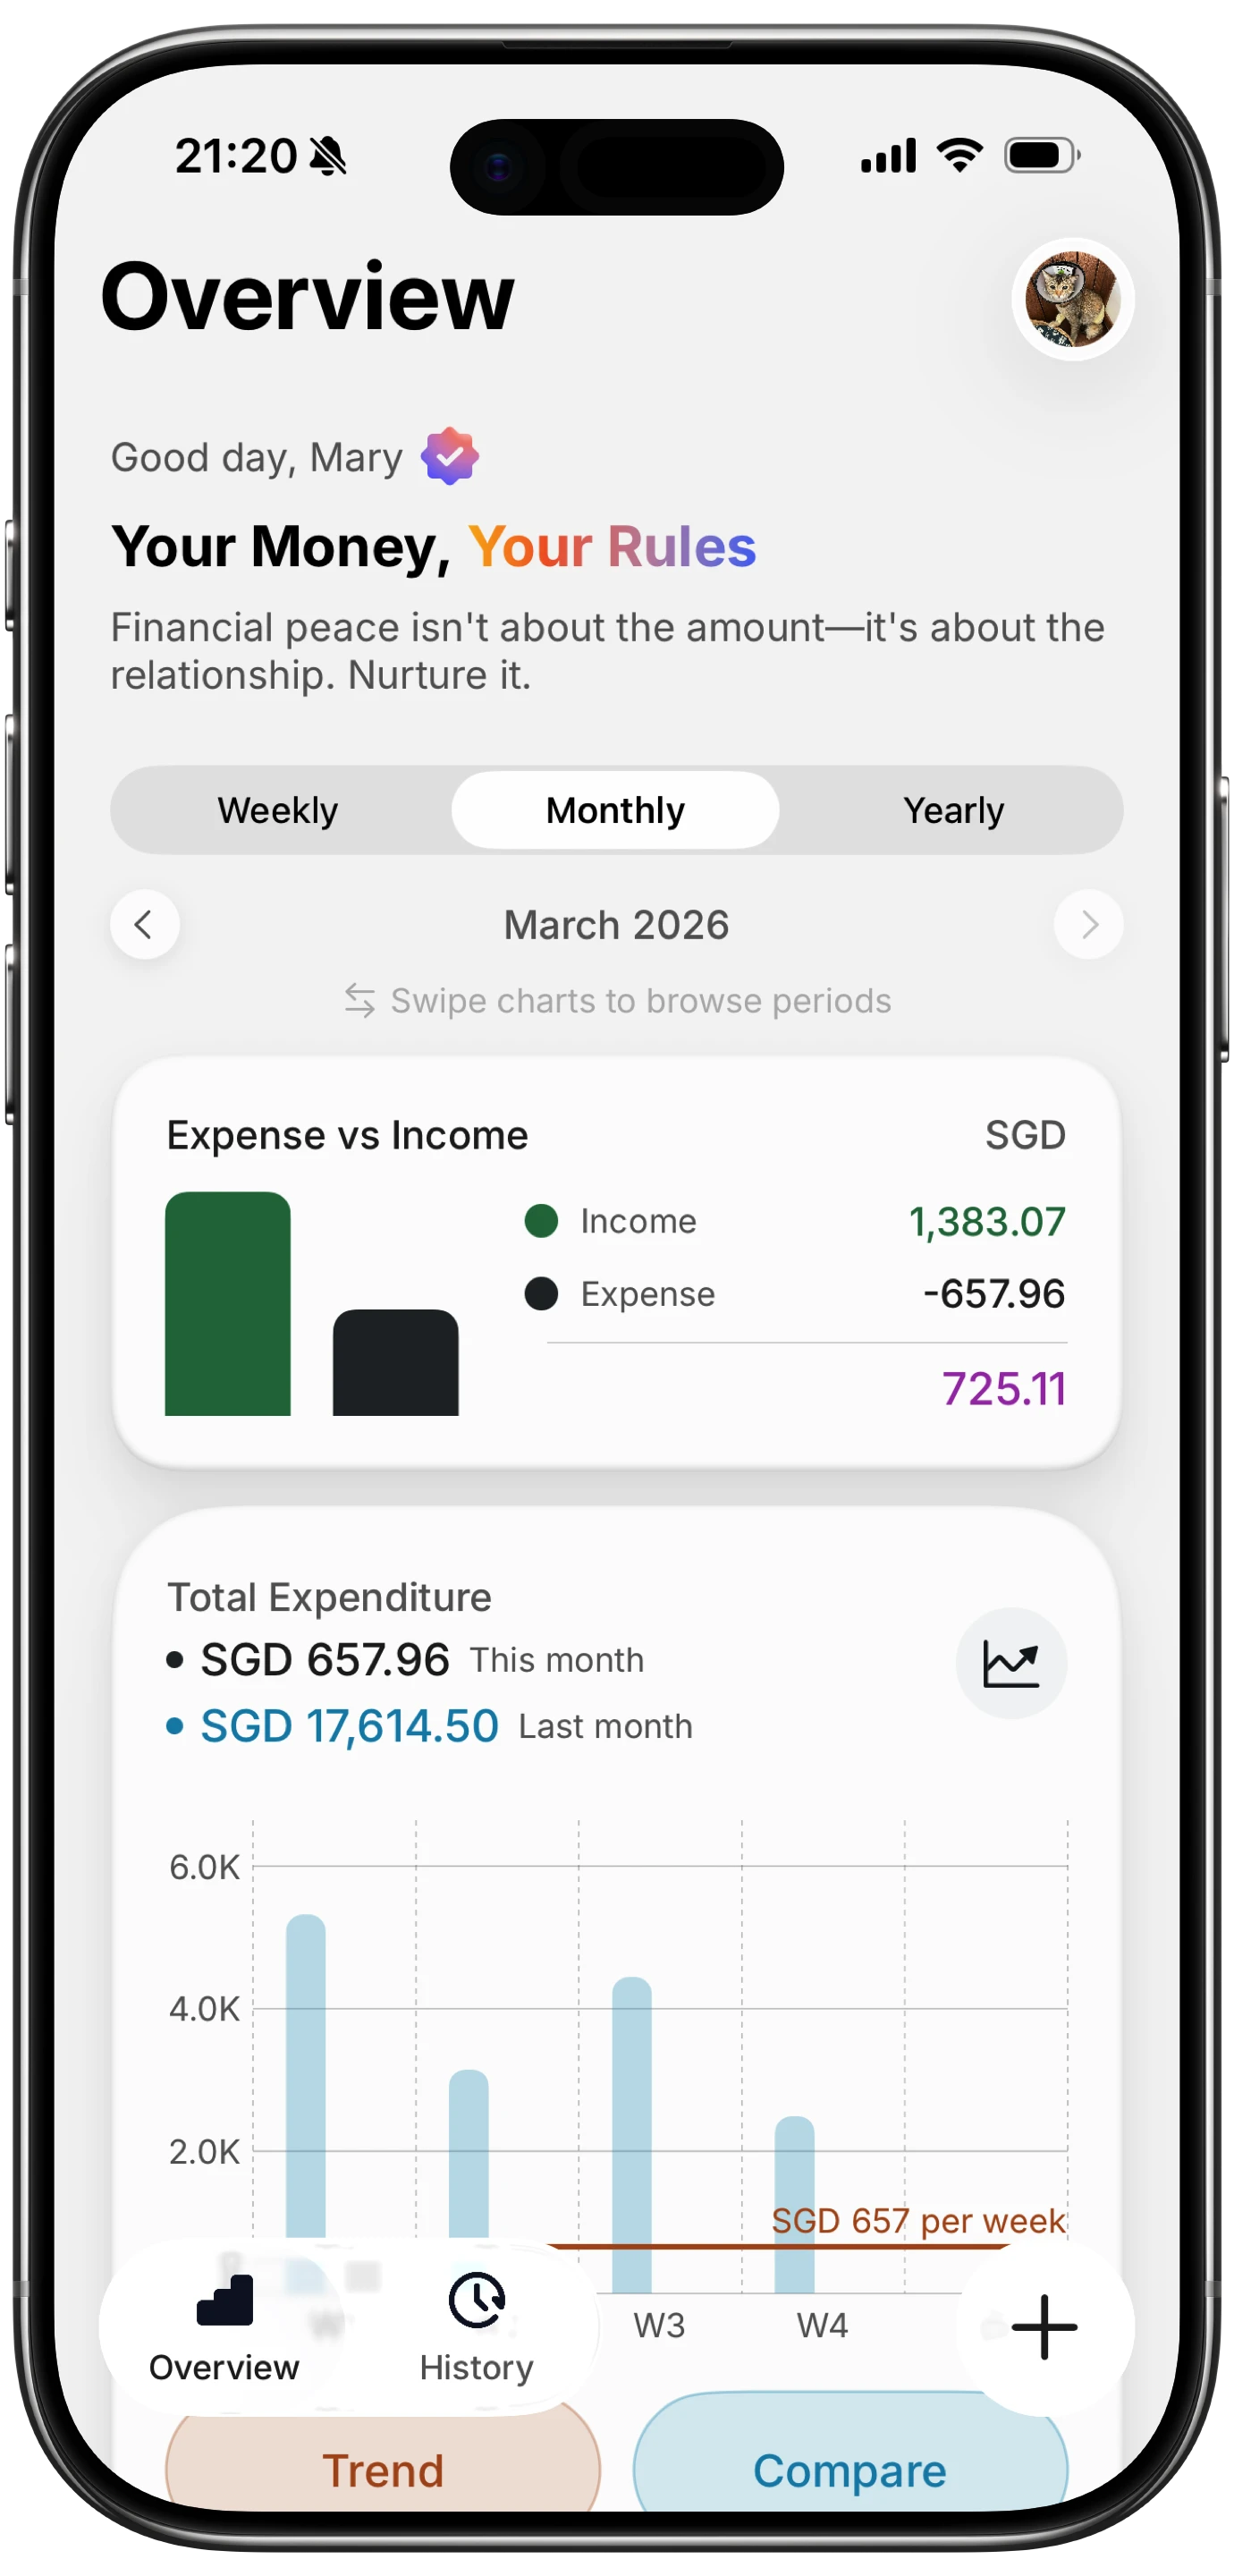
Finny app's Overview feature
Tagging seasonal purchases as they happen produces something more valuable than any national average: your own figure, which is the only benchmark that predicts next year.
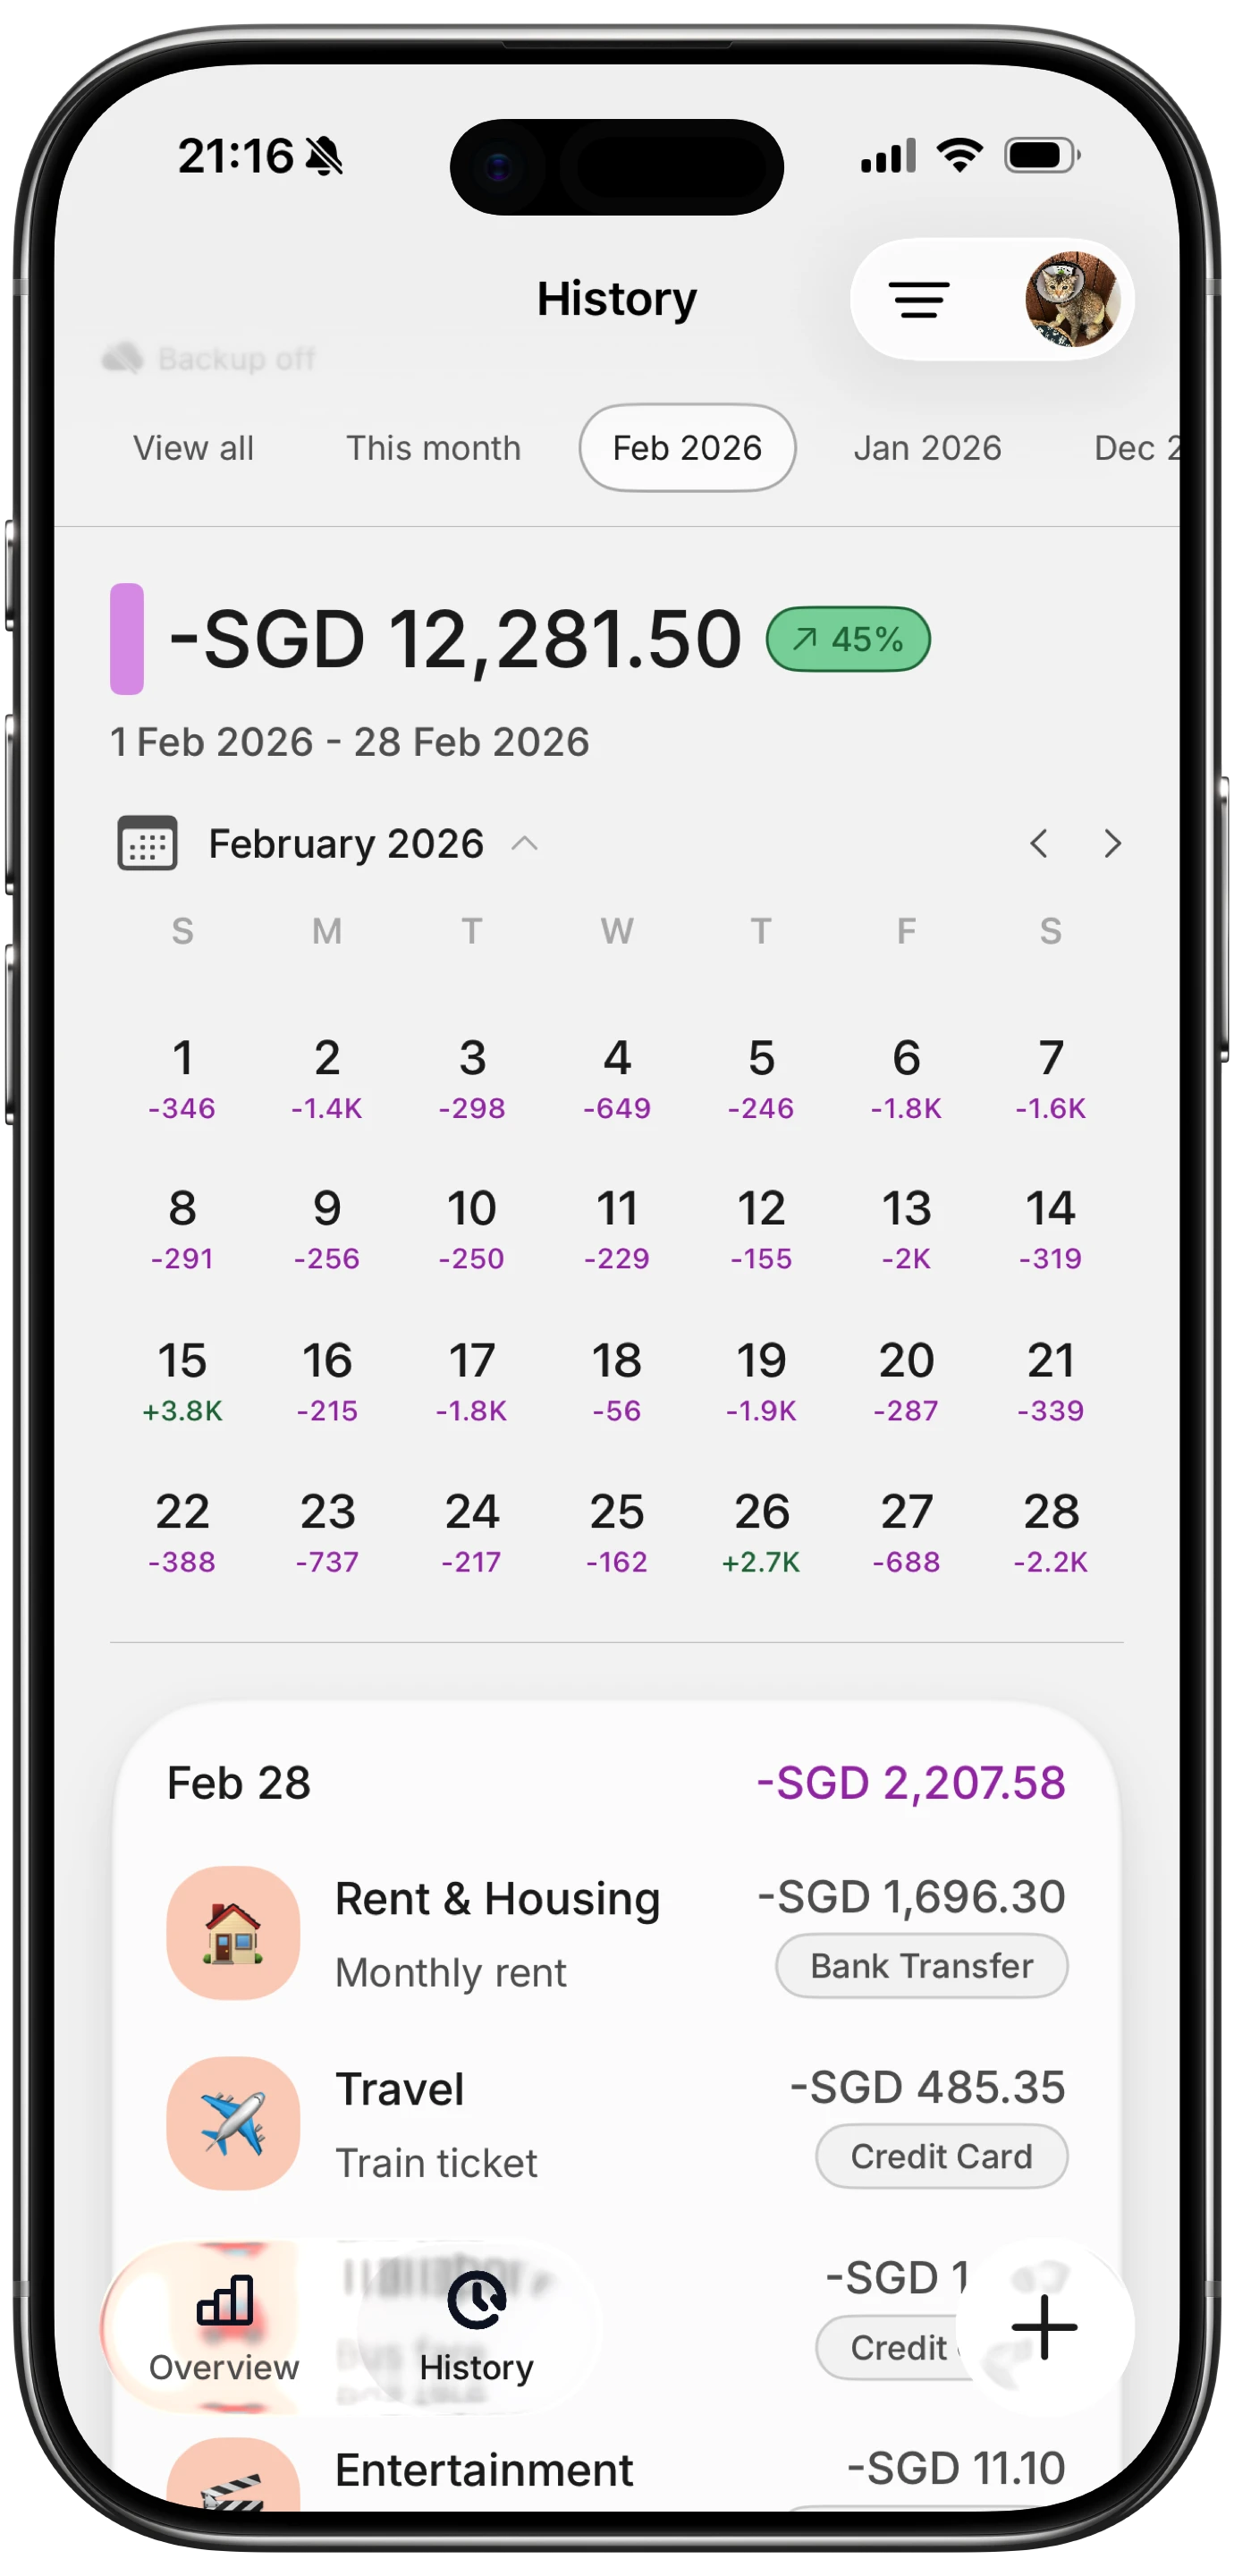
Finny app's History calendar feature
Finny captures purchases as they happen, including online orders logged from what is on screen, without a bank connection. Tag a holiday category in September and the seasonal total is available in January without reconstruction.
Most holiday purchases now happen online, and this video shows one being logged from the screen:
The Bottom Line
Americans spend roughly $890 per person across the full holiday season, of which about $628 goes to gifts, according to the most recent NRF survey. Gallup, measuring gifts alone, records higher October intentions of around $1,007 that fall to about $778 by November.
That gap between October intention and November reality is the finding worth acting on. Households that set a realistic number early are simply doing in September what everyone else is forced to do in late November, with more time and less pressure.
Common Questions About Christmas Spending
How much does the average American spend on Christmas?
The most recent National Retail Federation survey puts total holiday spending at $890.49 per person, covering gifts, food, decorations, and other seasonal items. Of that, $627.93 goes to gifts and $262.56 to everything else. Gallup, which asks only about gifts, has recorded October estimates around $1,007 falling to roughly $778 by November. The figures differ because they measure different scopes, not because either is wrong.
Why do Christmas spending surveys give different numbers?
Mainly scope and timing. NRF measures the entire season including food, decorations, and cards, while Gallup asks specifically about gifts, so a Gallup gift figure can exceed an NRF total. Surveys also run at different points in the autumn, and stated intentions fall as the season approaches and actual cash positions become clear. Averages are also pulled upward by a small number of very high spenders.
Is $500 too little to spend on Christmas?
No. The published averages are means across all households, inflated by high spenders and shaped by household size rather than by any standard of adequacy. A household with a shorter gift list, a family agreement to draw names, or an understanding that adults skip gifts will spend far under $890 without anyone feeling shortchanged. The number that matters is whether your total can leave your accounts without borrowing.
How much should I spend on Christmas gifts per person?
Work from your own total rather than a national figure. A workable structure is $75 to $150 for a partner or child, $40 to $60 for parents and siblings, $20 to $30 for wider family and friends, and $10 to $15 for courtesy gifts, adjusted so the sum fits your ceiling. List length affects the total far more than the amount per gift, so start by confirming who is actually on the list.
Ready to track expenses with less friction?
Download Finny to log expenses using AI, receipts, or text. No bank connections, offline support, and full control over your financial data.