How Much Does It Cost to Raise a Child in 2026?
Most parents have heard a big round number for what a child costs, usually north of $200,000. It is a hard number to plan around. It spreads 18 years of very different spending into one figure, and it comes from data that is now more than a decade old.
This guide breaks the cost to raise a child into usable pieces: the official estimate in today's dollars, the categories that drive it, childcare, spending by age, and the tax rules that lower the net cost. It ends with a simple way to estimate your own number.
If you are still expecting, our guide on how to budget for a new baby covers the first year in detail.
The Official Estimate, Then and Now
The best known figure comes from the U.S. Department of Agriculture. Its report Expenditures on Children by Families, 2015, released in January 2017, estimated that a middle-income married couple with two children would spend about $233,610 raising a child born in 2015 through age 17, in 2015 dollars. That excludes pregnancy and college. Lower-income families were estimated at $174,690 and higher-income families at $372,210.
That 2017 report is still the most recent edition, so every newer number is an adjustment of it:
- USDA's own projection with expected inflation came to $284,570 over the child's 17 years.
- Brookings, in a 2022 analysis, assumed 4% yearly inflation and arrived at $310,605.
- In today's prices, restating $233,610 from the 2015 average Consumer Price Index (237.0) to the September 2026 index of 336.9 published by the Bureau of Labor Statistics gives roughly $332,000. That is our own arithmetic, not an official estimate.
Treat all of these as rough anchors. They describe one family type and assume spending patterns from 2015, before childcare prices and housing costs climbed as fast as they have.
Where the Money Goes: The Biggest Categories
The USDA estimate splits spending on a child into seven groups. For middle-income married couples, the shares looked like this:
| Category | Share of total |
|---|---|
| Housing | 29% |
| Food | 18% |
| Childcare and education | 16% |
| Transportation | 15% |
| Healthcare | 9% |
| Miscellaneous (personal care, entertainment, reading) | 7% |
| Clothing | 6% |
Housing is the largest piece because it covers the extra bedroom and the bigger home many families move into. Food grows steadily with age.
Childcare and education varies the most from family to family. A household with a stay-at-home parent or nearby grandparents might spend little here, while two working parents in a large city can spend more on childcare than on rent.
Transportation includes the share of car payments, gas, and insurance tied to driving kids around, and later the cost of a teen driver. Healthcare covers premiums for adding a child to a plan plus out-of-pocket costs.
These are national averages, and your own split may look quite different.
Childcare: The Cost That Changes the Math
For families who pay for it, childcare is often the single largest kid expense in the early years.
The Department of Labor's National Database of Childcare Prices is the most detailed federal source. Its November 2024 update, covering 2022 prices in 2,512 counties, found that full-day care for one child cost between $6,552 and $15,600 a year, or 8.9% to 16% of median family income, depending on the county, the child's age, and the type of care. Infant care in a center was the most expensive setting.
Child Care Aware of America, a national nonprofit, put the 2024 national average price of child care at $13,128 a year. It found that figure was about 10% of a married couple's median income and about 35% of a single parent's.
At that national average, two children in full-time care would cost more than $26,000 a year. That is why the years before kindergarten often feel like the most expensive, even though the USDA estimates spending per child rises with age overall.
Cost by Age: How Spending Shifts Over 18 Years
The USDA estimated that a middle-income married couple spent $12,350 to $13,900 a year on a child in 2015 dollars, lowest in the first years and highest for teenagers ages 15 to 17. What changes most is the mix.
Ages 0 to 2. Diapers, formula, gear, more pediatric visits, and, for working parents, full-time care.
Ages 3 to 5. Preschool or daycare usually remains the biggest item.
Ages 6 to 11. Public school replaces full-day care for many families, but before and after school care, summer camps, and activities often fill the gap. Sports fees, lessons, and school supplies become regular line items.
Ages 12 to 17. Food spending climbs, a phone plan gets added, and activities can get more expensive with travel teams or competitions. A teen driver can raise car insurance noticeably. Many families also start giving an allowance or a card, and our guide to tracking a teen's spending with Apple Cash Family covers one way to do that.
College is not included in any of these figures. If you plan to help, it is a separate savings goal on top of the 18 years.
How to Estimate Your Own Number
National averages are a starting point. Your own estimate will be closer if you build it from local prices and your actual habits:
- Price childcare first. Call two or three nearby providers, or look up your county in the National Database of Childcare Prices. For many families, this one line decides the budget.
- Price the housing change. If a child means a bigger place, the extra rent or mortgage is the honest number, not a share of it.
- Check your health plan. Look up the premium difference between your current coverage and a plan with a dependent, plus the family deductible.
- Add recurring extras. Activities, a phone, school costs, and clothing, on a yearly basis.
- Track real spending for three months. Once your child is here, actual numbers beat any estimate. Multiply three months by four for a yearly figure, and redo it once a year. A shared family budget app makes this easier when two parents are paying.
Family size matters too. The USDA found that families with three or more children spent about 24% less per child than a two-child family, because clothing, rooms, and gear get shared. An only child cost about 27% more.
Tax Help That Lowers the Net Cost
Several federal tax rules reduce what a child costs on paper. These are general descriptions, not tax advice, and amounts change, so check IRS.gov or a tax professional before you plan around them.
The Child Tax Credit is currently worth up to $2,200 per qualifying child under 17, with up to $1,700 of it refundable, subject to income limits. Check the IRS page for the figures for the year you are filing.
A dependent care flexible spending account, if your employer offers one, lets you set aside pre-tax money for childcare. For 2026, the limit rose to $7,500 per household, or $3,750 if married filing separately, according to IRS Publication 15-B.
The Child and Dependent Care Credit, explained in IRS Publication 503, covers part of work-related care costs. The same expenses generally cannot count toward both the FSA and the credit, so it is worth running the numbers both ways with your tax software or preparer.
Track What Your Child Actually Costs
Every estimate above is an average of other families. The only way to know your own number is to record it. In Finny, a hashtag per child turns everyday logging into a running total for each kid, whatever category the spending lands in.
One hashtag per child
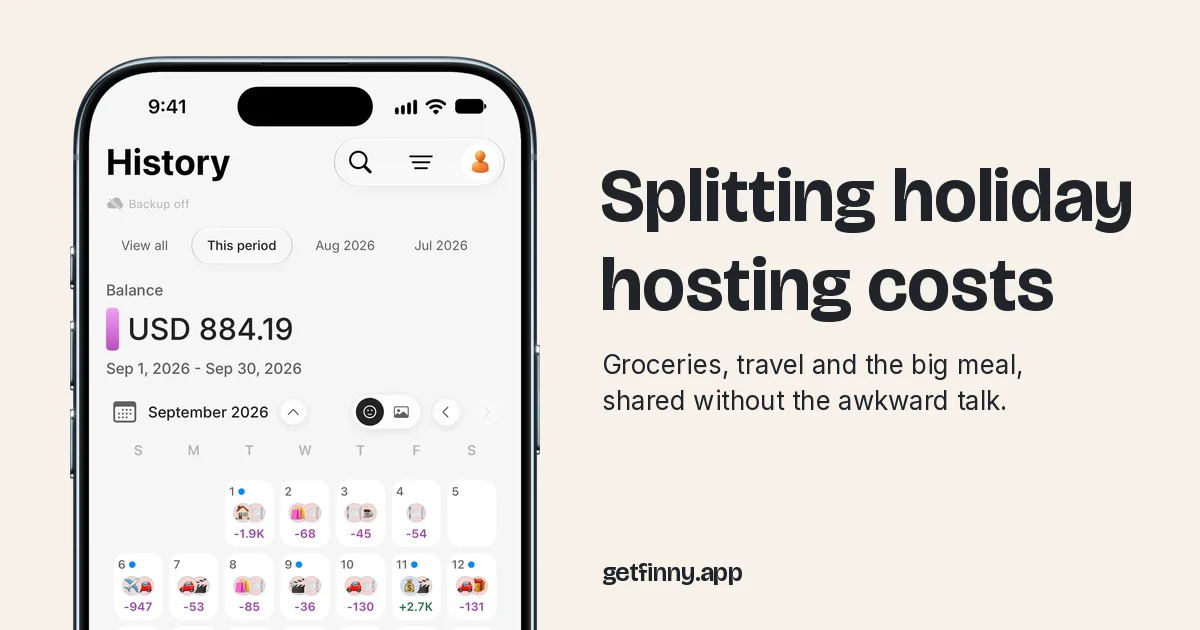
Log costs as they happen and History shows them day by day: a calendar with each day's total, the category icons of what you spent, and the month's balance.
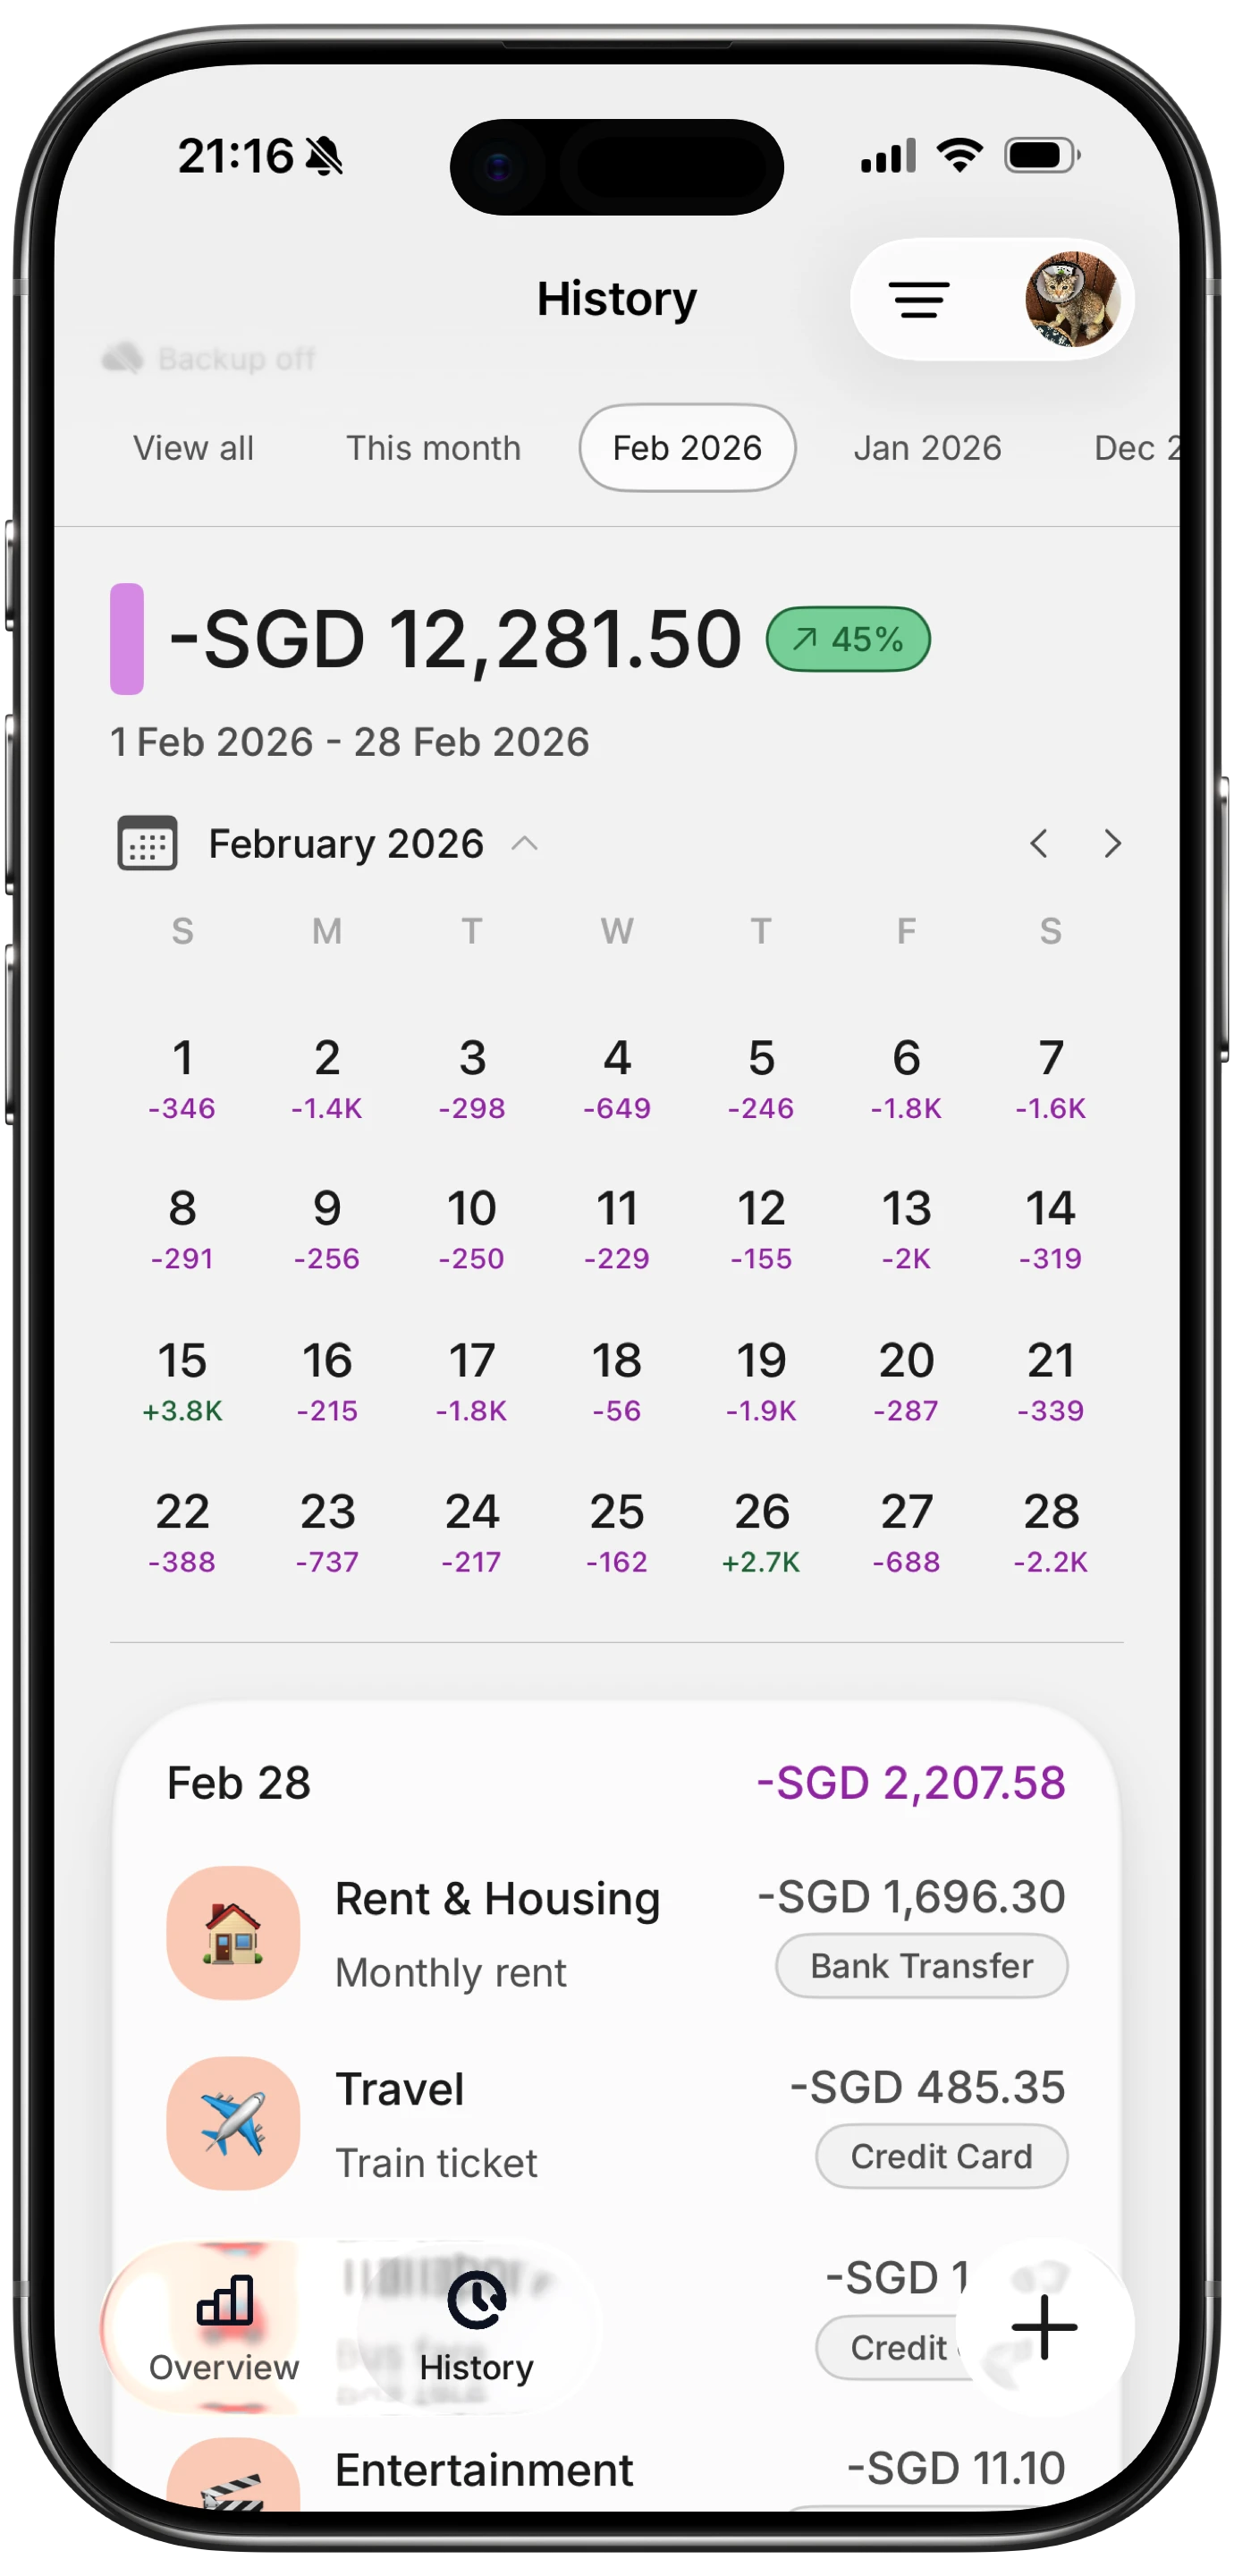
Finny app's History calendar feature
Tag each kid expense with the child's name, like #Maya. A dentist copay stays in Healthcare and a soccer fee stays in whatever category you file it under, but searching #Maya shows everything she cost, totaled in your home currency and split by category and payment method. Tags never change category totals. Adding and filtering tags needs Finny Pro.
Give new kid costs their own category
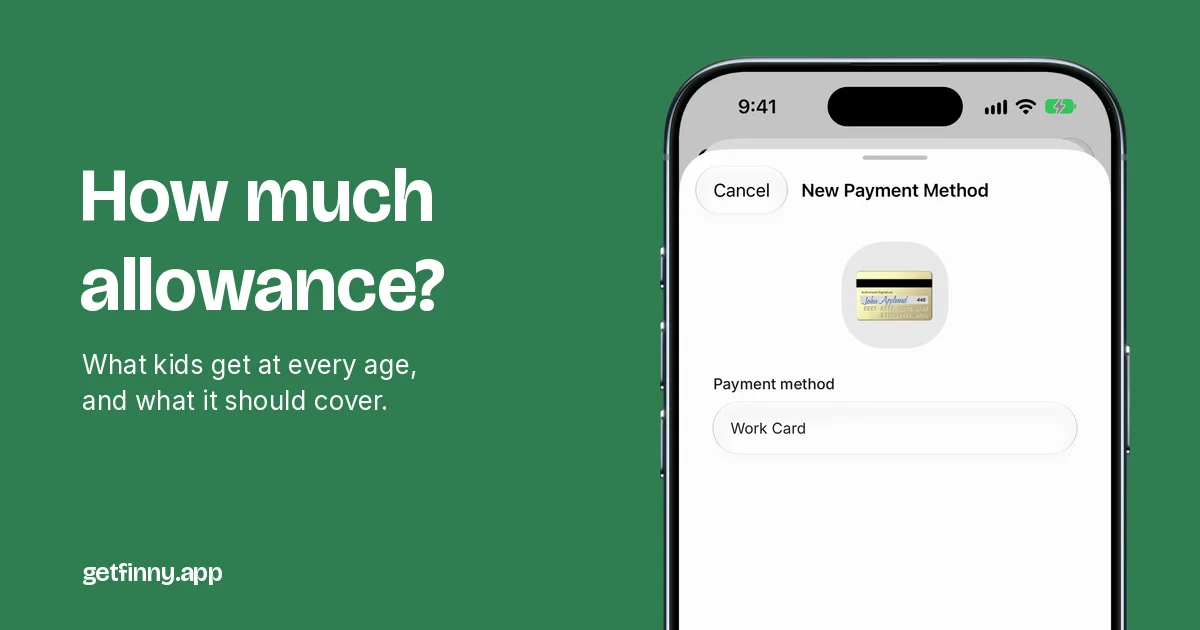
Custom categories each get their own icon. The sheet below creates a category called Parking with a car icon, handy if school pickups and practices come with parking fees.
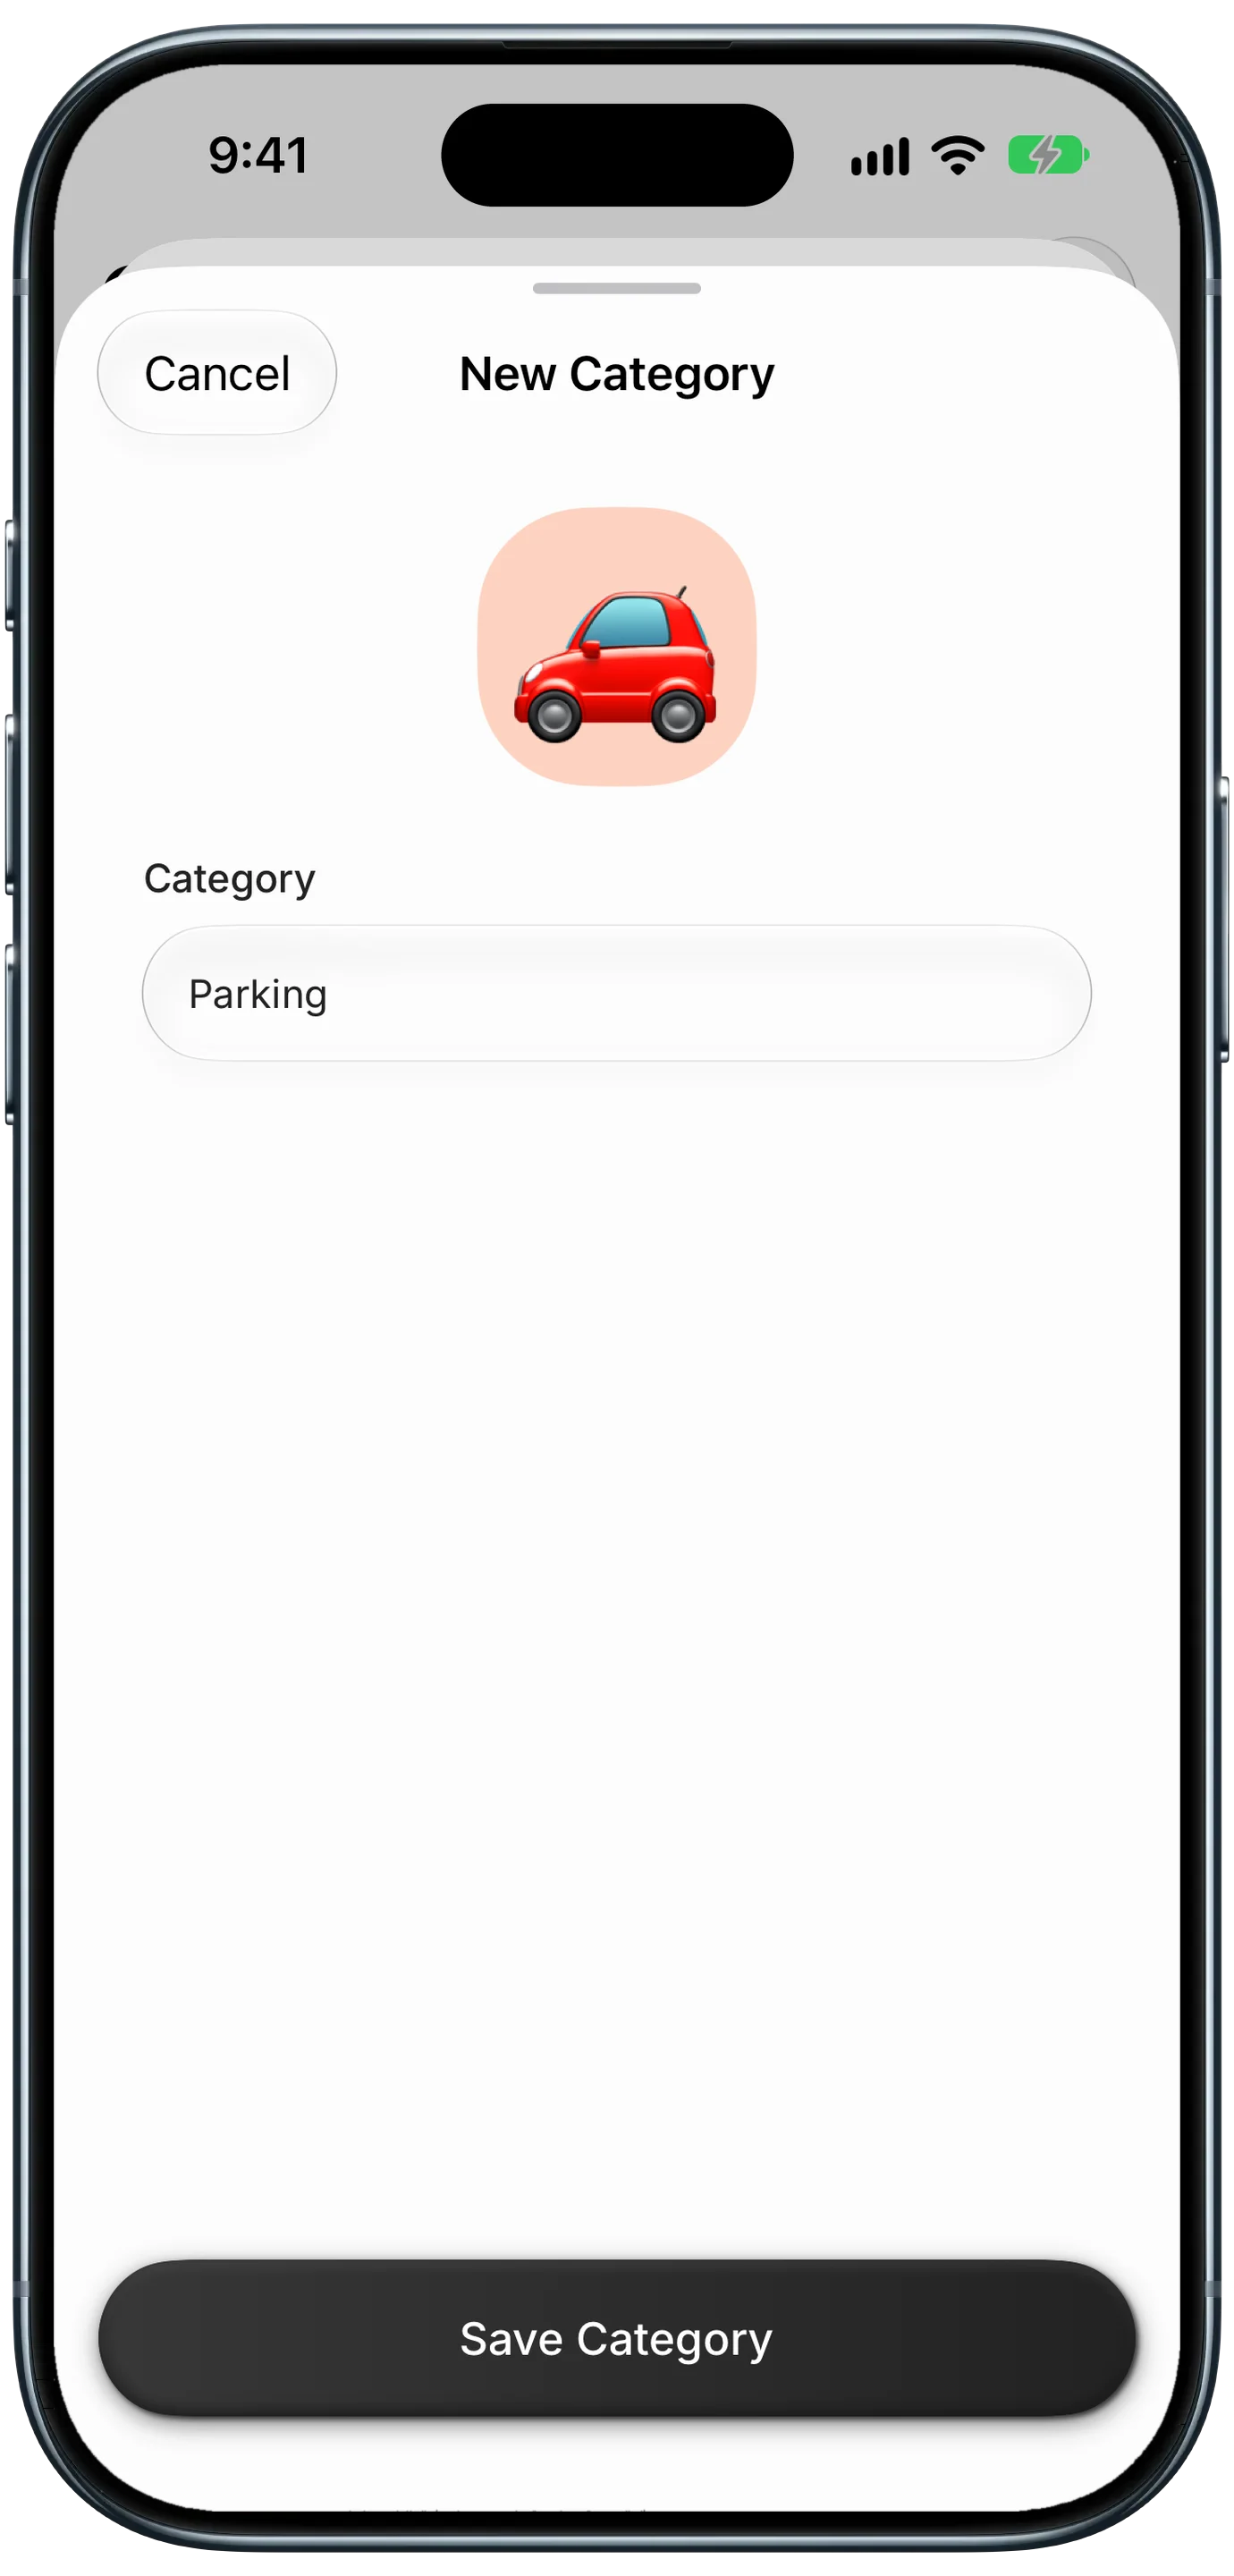
Finny app's categories feature
Daycare tuition or a monthly lesson can also be set up as a free recurring rule with a reminder, so it is logged on schedule.
Watch the trend on Overview
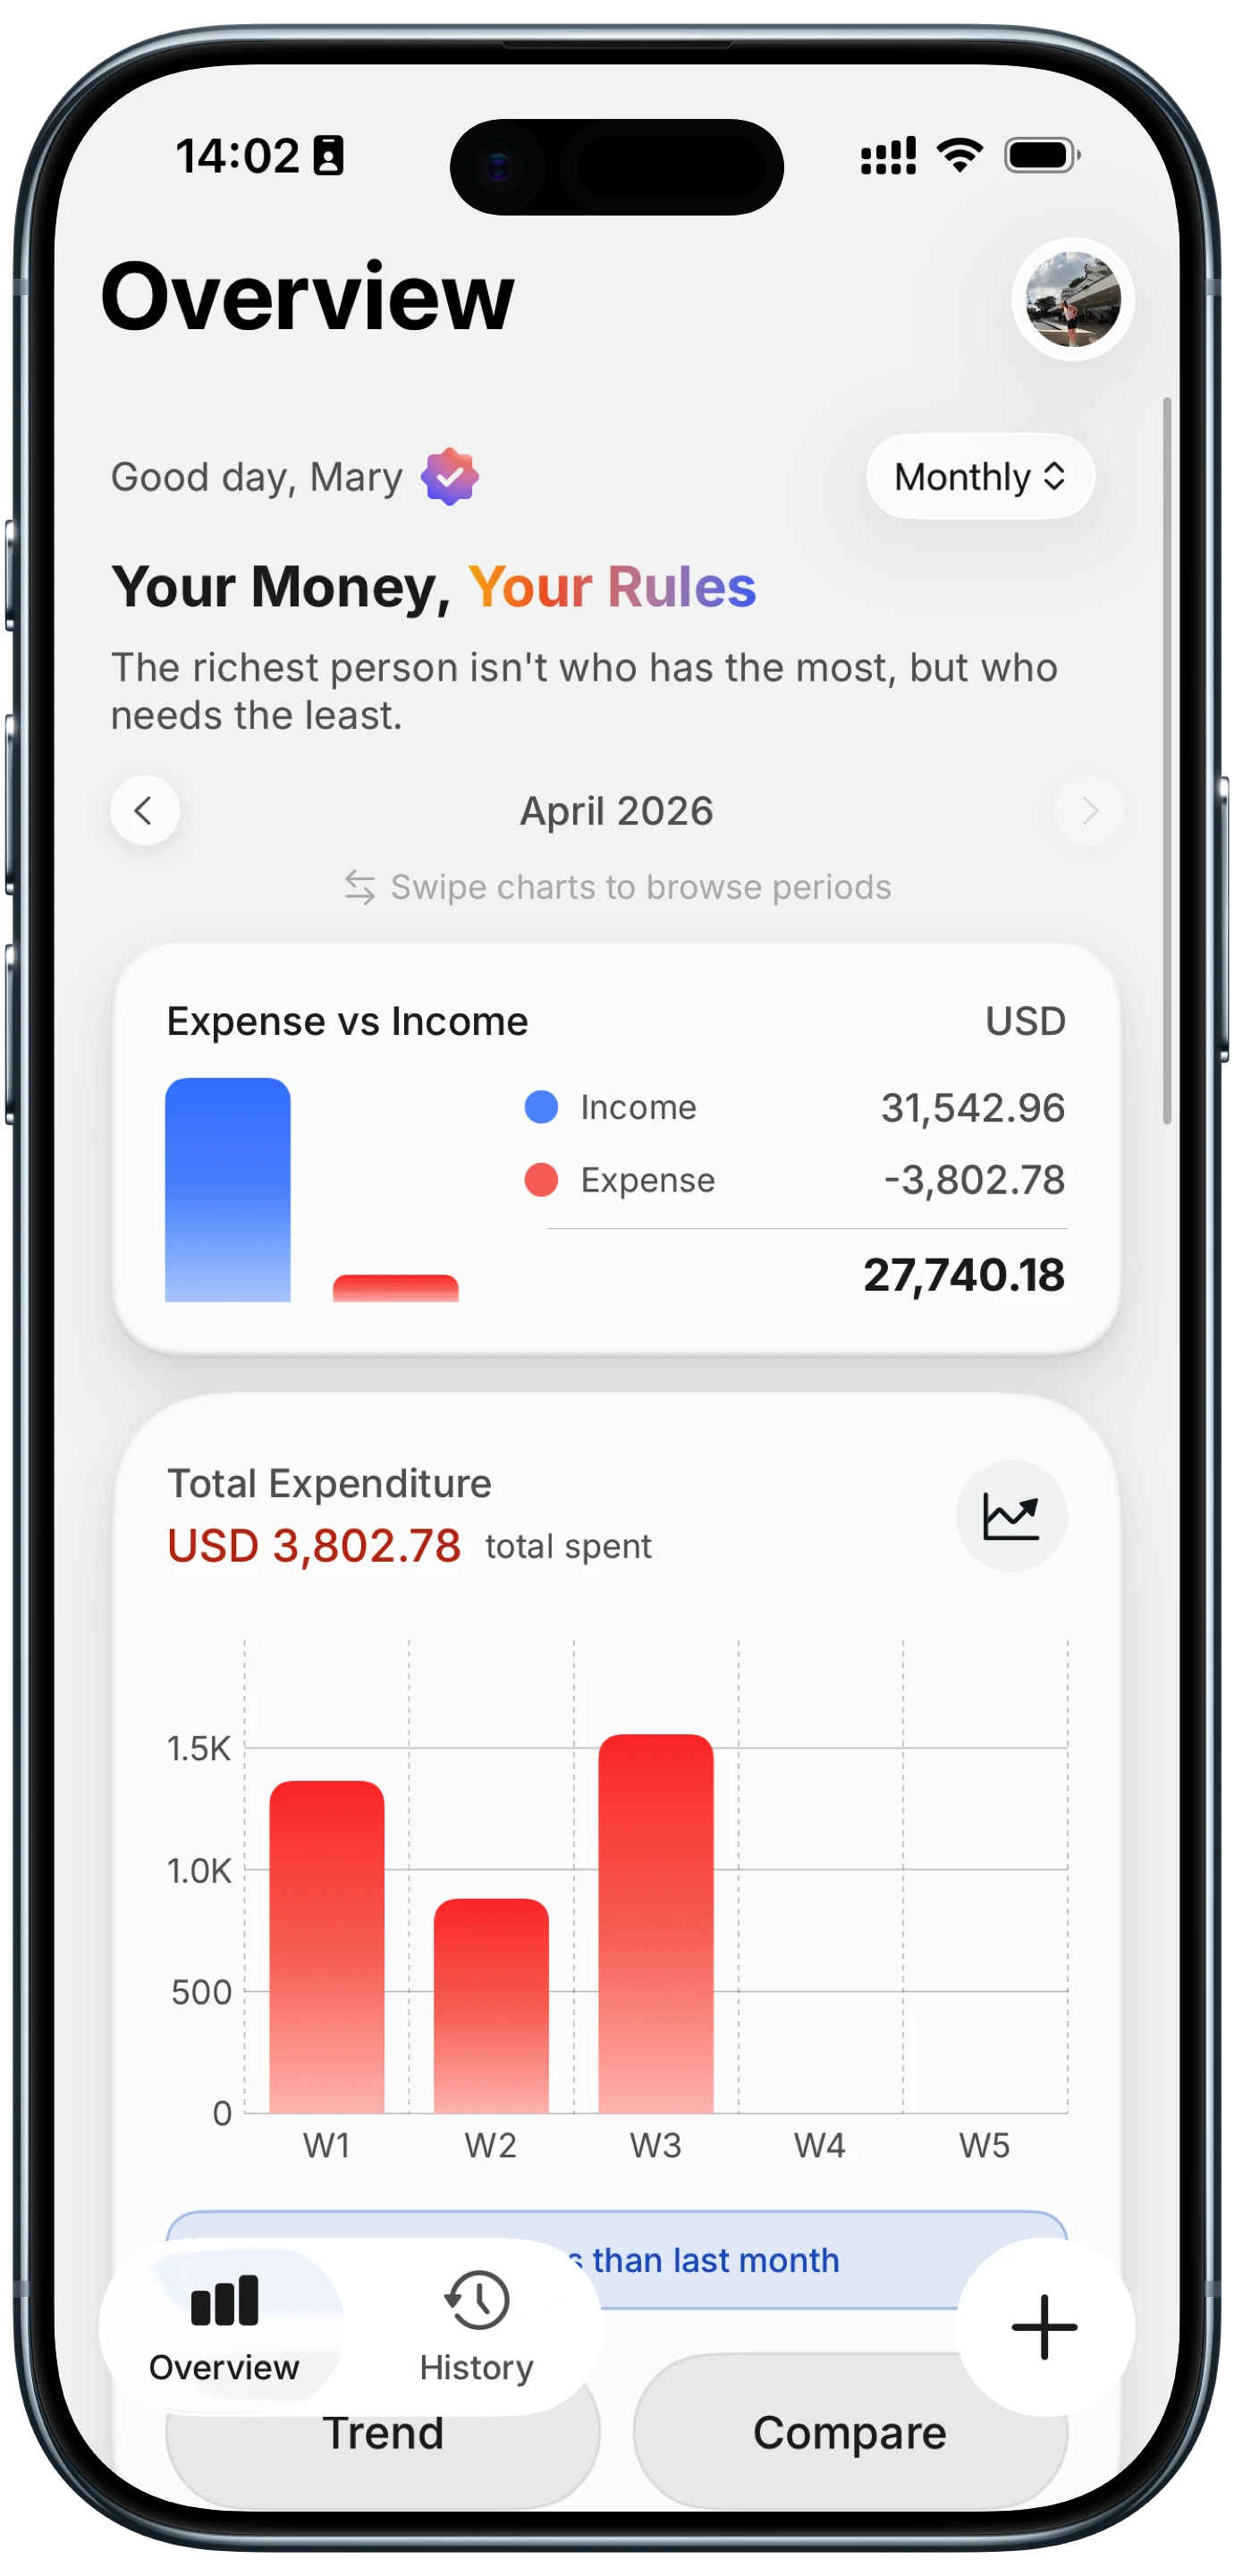
Overview charts your total spending by week and tells you how much more or less you spent than last period, with Trend and Compare views.
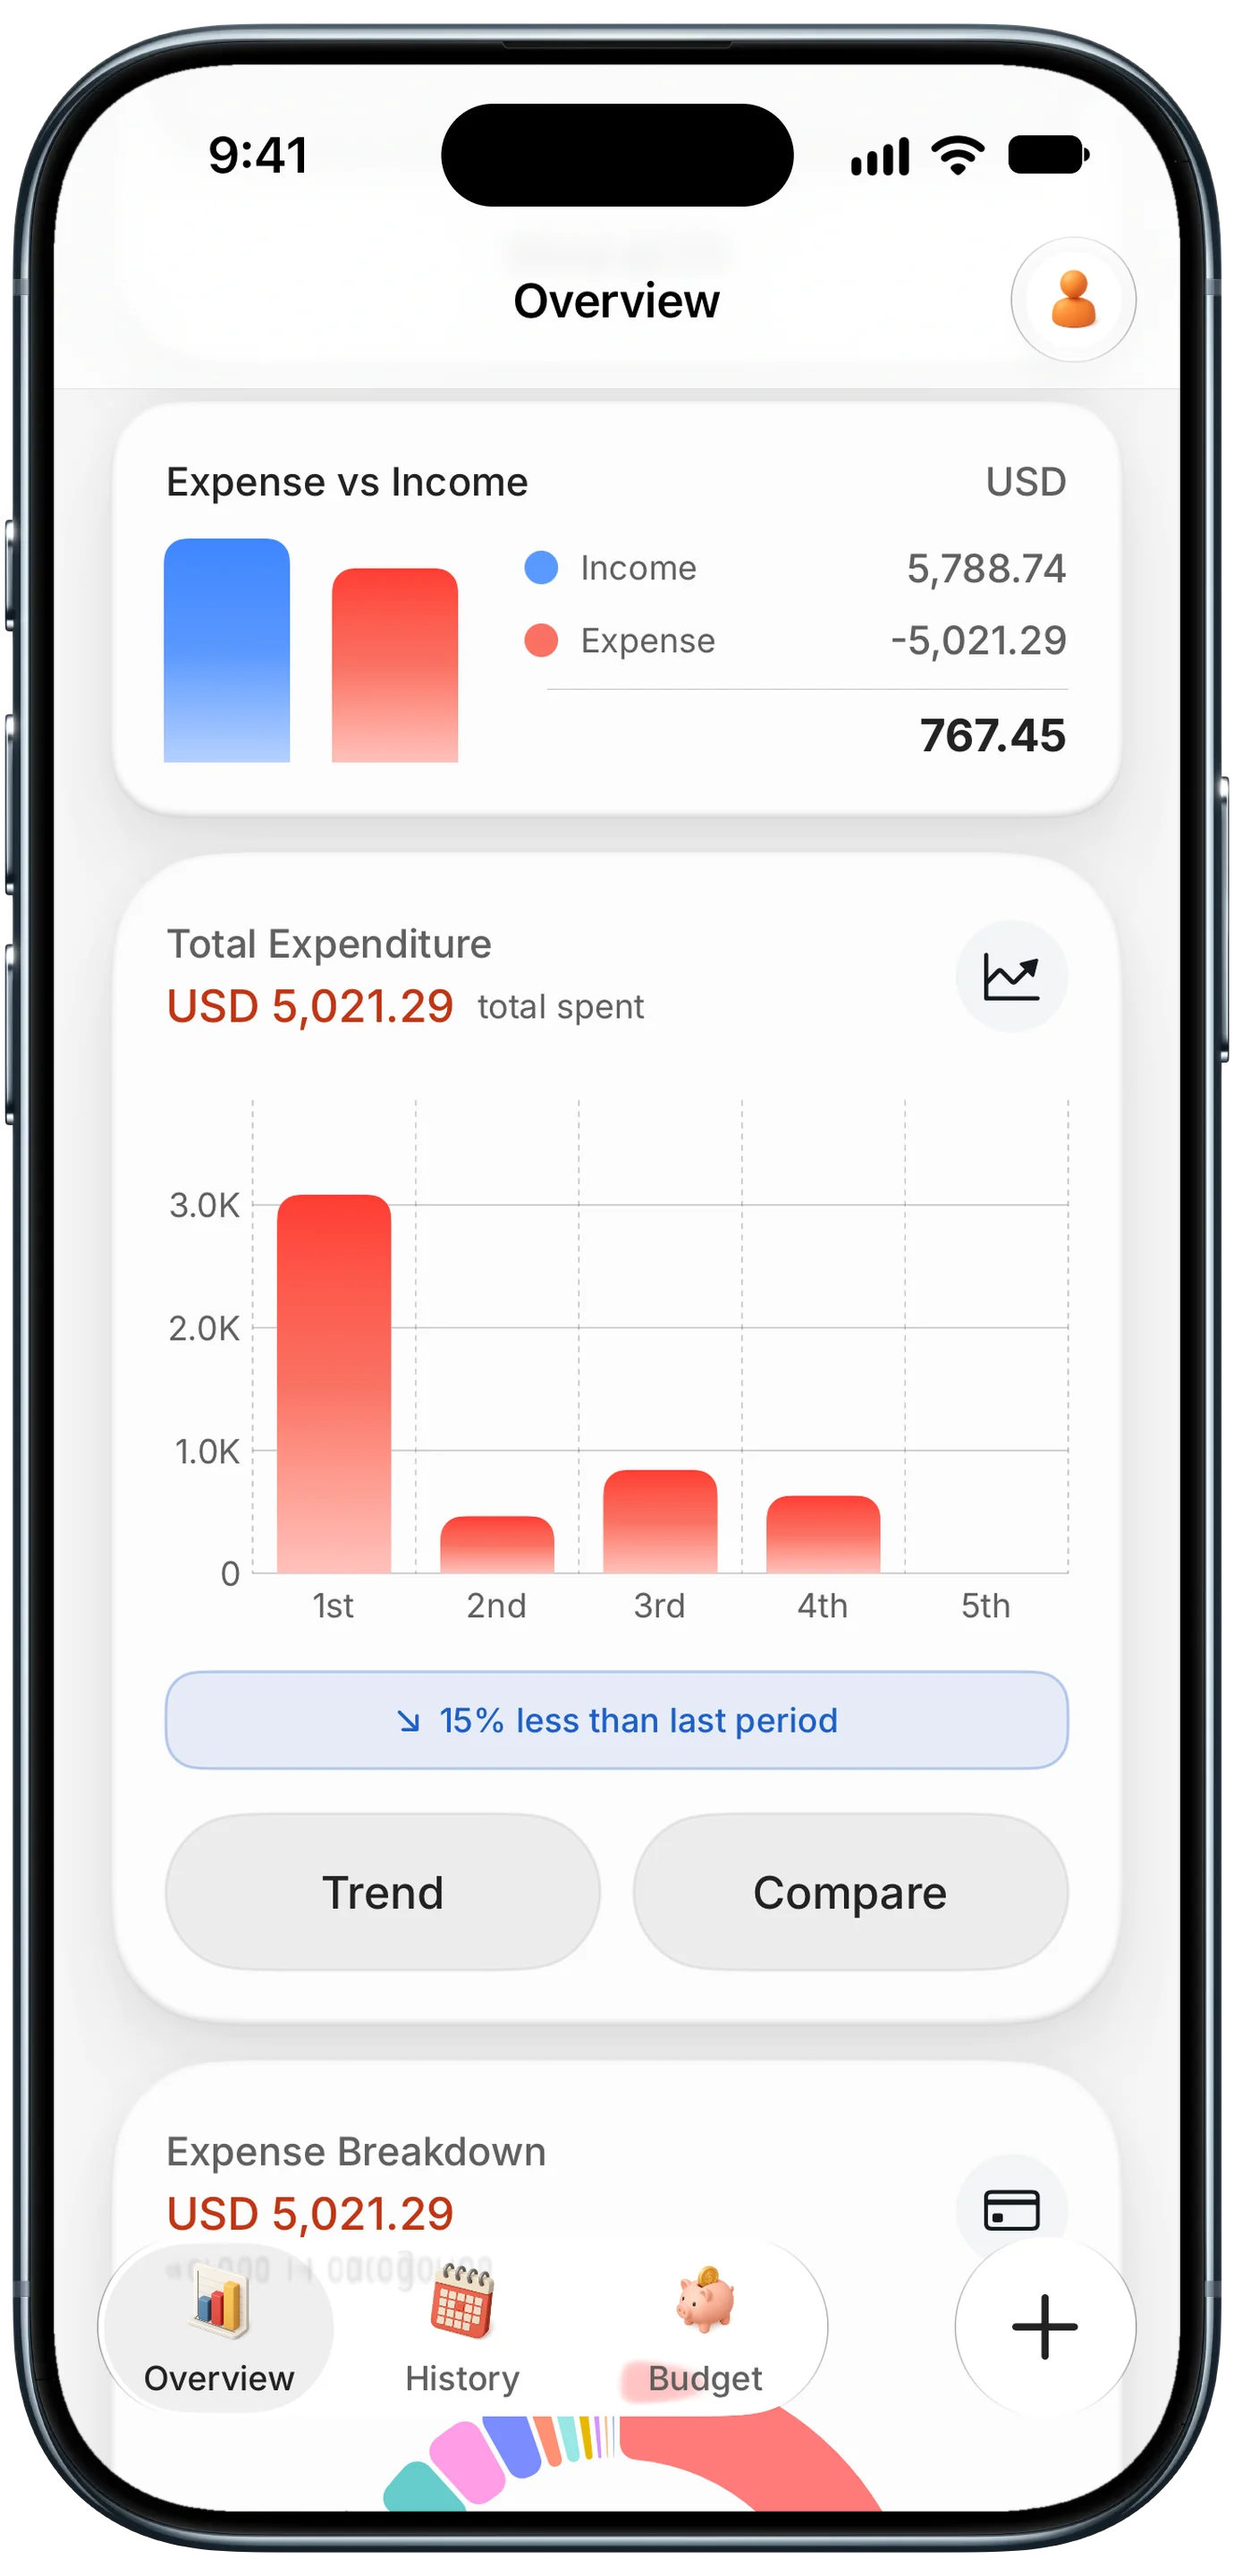
Finny app's Overview feature
Overview covers all your spending, not one tag, so it is where you see the bigger shift when daycare starts or camp season arrives.
Share it with the other parent
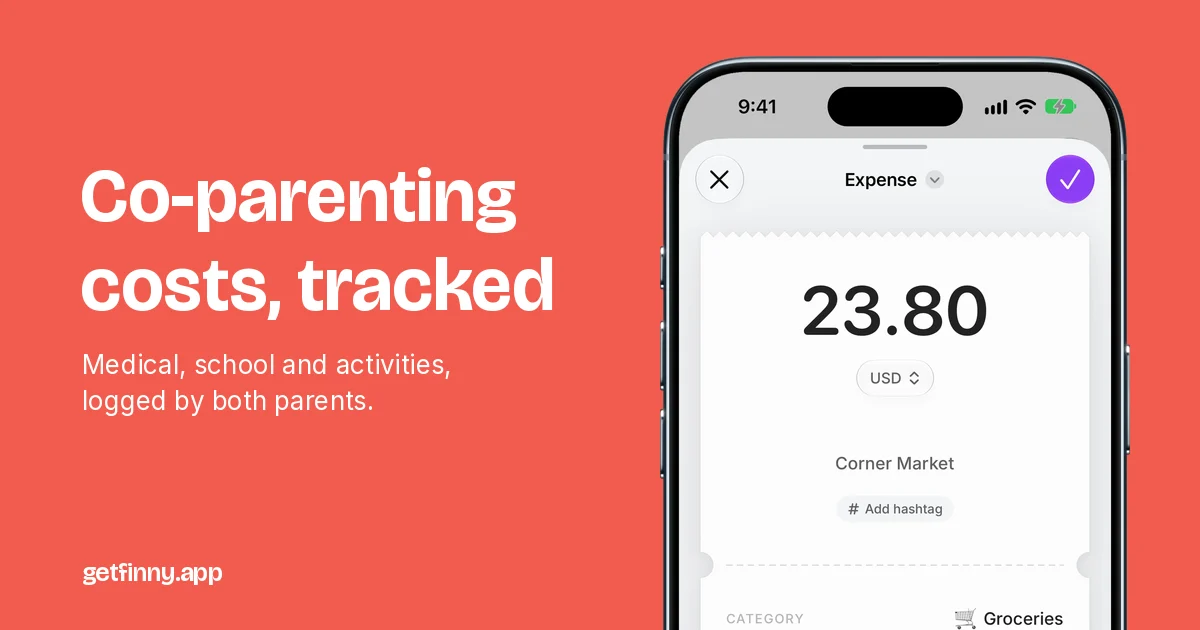
Two parents can share kid entries with Finny Households while keeping everything else private, and search one child's tag to see what both of you spent. It shows who paid for what, but it does not calculate who owes whom. Here is a quick look at Households in action:
The Households launch post explains the setup. Parents in two homes can find a full routine in our guide to co-parenting expenses.
Common Questions About the Cost to Raise a Child
How much does it cost to raise a child per year?
The USDA's most recent estimate found a middle-income married couple spent $12,350 to $13,900 a year on a child in 2015 dollars. Adjusted for inflation through September 2026, that is very roughly $17,500 to $19,800 a year. Your number can be far lower or higher depending on childcare, where you live, and your income.
Does the cost to raise a child include college?
No. The USDA estimate of $233,610 covers a child from birth through age 17 and leaves out both pregnancy costs and college. If you plan to help with college, treat it as a separate goal with its own savings plan, such as a 529 account. Starting small contributions early gives the money more years to grow.
Is a second child cheaper than the first?
Per child, usually yes. The USDA found that families with three or more children spent about 24% less on each child than families with two, and an only child cost about 27% more per child. Clothes, gear, and bedrooms get shared. Childcare is the big exception, since two children in care usually means two full tuition bills, though some providers offer a sibling discount.
What is the most expensive age to raise a child?
It depends on what you pay for. In the USDA data, yearly spending was highest for teenagers ages 15 to 17, a stage when food, transportation, and activity costs tend to grow. For families paying for full-time childcare, though, the infant and preschool years often cost the most out of pocket, since one year of center care can top $15,000 in higher-cost counties. Tracking your own spending by age shows which pattern fits your family.
Curious what each of your kids really costs?
Download Finny to log expenses by typing, speaking, or scanning a receipt, tag each child, and see the totals add up, with no bank connection required.